


INTRODUCTION
Knowing the lipid content of marine microalgae is important for understanding their metabolism and for the use of their biomass as biofuel. Among them, dinoflagellates contain large amounts of high-quality lipids and dinosterols (Piretti et al. 1997, Mansour et al. 1999).
Dinoflagellates play diverse roles in the marine food web as primary producers, prey, predators, symbionts, and parasites (Muscatine 1990, Coats 1999, Jeong et al. 2010, 2012, Lee et al. 2014a, 2014b). In the last two decades, many phototrophic dinoflagellates that were previously thought to be exclusively autotrophic have been shown to be mixotrophic (Jacobson and Anderson 1996, Stoecker 1999, Jeong et al. 2005, 2010, Lee et al. 2014c). Therefore, these protists not only perform photosynthesis, but also feed on prey as energy sources. Furthermore, many dinoflagellates are important prey for mixotrophic and heterotrophic protists and metazoans (e.g., Jeong et al. 2010). Thus, they are a major source of fatty acids, sterols, and other nutrients to these predators. Also, they often dominate the plankton assemblages and sometimes form red tides or harmful algal blooms in the waters of many countries (Hallegraeff 1993, Anderson 1997, Park et al. 2013). Approximately 75% of the harmful algal bloom species are dinoflagellates (Smayda 1997). As a result of their very high concentrations during explosive and extensive blooms, they have been studied as a potential candidate for a source of biofuel (de la Jara et al. 2003, Fuentes-Grünewald et al. 2012, 2016). Thus, it is very important to analyze the lipid content of many dinoflagellates within relatively short time by using reasonable lipid quantification methods.
To analyze the lipid content of a dinoflagellate species, clonal cultures of target species should be established first and then a large amount of the culture should be harvested to obtain a large quantity of its biomass. This process usually takes a long time and is also very laborious. Chloroform and methanol based lipid extraction methods have been widely used for lipid quantification (Folch et al. 1957, Bligh and Dyer 1959). However, the conventional Folch or Bligh and Dyer’s method in which lipids are extracted using chloroform and methanol requires a large amount of biomass and thus, usually requires a great deal of time and labor. The process of drying, extraction, weighing, and transesterification of samples for gas chromatography analysis may also take several days and can be laborious work. Thus, development of easier and rapider methods of quantifying the lipid content of microalgae is required.
The sulpho-phospho-vanillin (SPV) method has been used for the determination of the total lipid content in human cerebrospinal fluid (Drevon and Schmit 1964, Vatassery et al. 1981), as well as in serum, food, and ecological samples. The SPV assay produces a distinct pink color when reacting with lipids, and the intensity of the color can be quantified by measuring the absorbance at 530 nm using spectrophotometric methods. The advantages of this technique are that it is able to measure lipid content rapidly and simply and requires only a small amount of target sample. Thus, this method has been employed for rapid quantification of the intracellular lipid contents of some microalgae (Hao et al. 2013, Mishra et al. 2014, Byreddy et al. 2016).
In this study, we applied a modified SPV method for quantifying the lipid content of dinoflagellate species. Furthermore, using this method, we analyzed the lipid content of 9 dinoflagellate species including phototrophic, mixotrophic and heterotrophic species (Amphidinium carterae, Heterocapsa triquetra, Prorocentrum minimum, Alexandrium minutum, Oxyrrhis marina, Scrippsiella trochoidea, Ostreopsis cf. ovata, Prorocentrum micans, and Lingulodinium polyedrum), 1 chlorophyta (Dunaliella tertiolecta), and 1 diatom (Thalassiosira sp., 30 μm). Moreover, the relationships between lipid content and cell sizes or volumes of the dinoflagellates were explored.
MATERIALS AND METHODS
Reagents and standard curve preparation
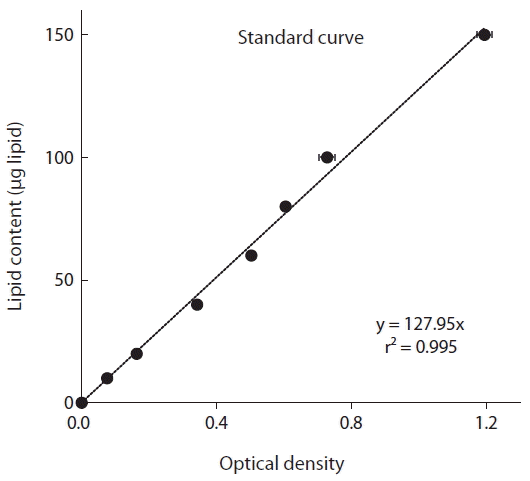
Concentrated sulfuric acid, o-phosphoric acid (85%), chloroform, and methanol, all American Chemical Society (ACS) grade, were purchased from Thermo Fisher Scientific Inc. (Waltham, MA, USA) and Junsei Chemical Co., Ltd. (Tokyo, Japan). Vanillin (≥98%) was purchased from Sigma-Aldrich (St. Louis, MO, USA). The phospho-vanillin reagent was prepared by dissolving 0.75 g vanillin in 0.125 L distilled water and mixed with 500 mL of 85% phosphoric acid solution. The final concentration of reagent was 1.2 mg vanillin per mL of 68% phosphoric acid (Inouye and Lotufo 2006). For standard lipid stock, commercial Canola oil was obtained from the local market.
For preparation of the standard curve, commercial Canola oil was dissolved in chloroform (10 mg in 10 mL for a final concentration of 1 mg mL−1), and different concentrations (10–150 μg) of standard lipid samples were prepared in clean glass vials. The vials were incubated at 90°C for 10 min to evaporate the chloroform. Concentrated sulfuric acid (0.1 mL) was added to each vial, and then heated at 90°C for 10–20 min. After cooling on ice about 5 min, 2.4 mL of phospho-vanillin reagent was added and allowed to develop for 10 min, until the color of the sample turned pink. Absorbance was measured at 530 nm using a spectrophotometer (Jenway-7300; Bibby Scientific, Stone, UK).
Color reaction of four dinoflagellate species in different cell numbers
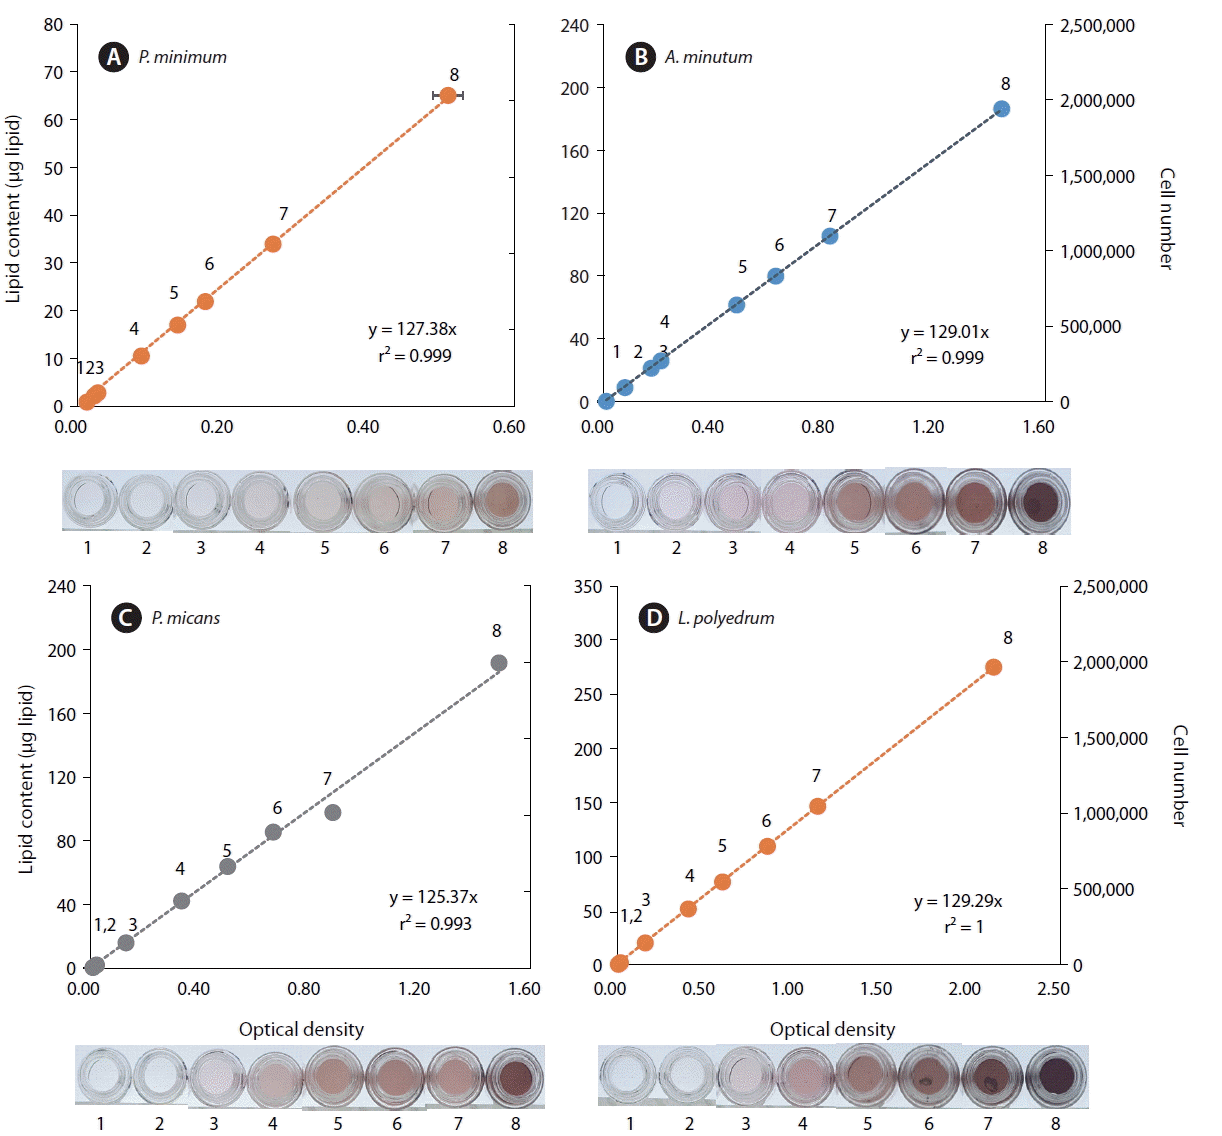
To observe the color reaction of dinoflagellate lipids at different cell concentrations, we analyzed lipid contents of four dinoflagellate species: Prorocentrum minimum, Alexandrium minutum, P. micans, and Lingulodinium polyedrum.
Each species was grown at 20°C in enriched f/2 seawater media (Guillard and Ryther 1962) under a continuous illumination of 20 μE m−2 s−1 provided by cool white fluorescent lights. Cultures were grown for 5–7 days, until the cell number was high enough for analysis (over 1.5 × 10⁷ cells), at which point, the cells were collected. Four dinoflagellate species were prepared depending on cell concentration from 1,000 to 2,000,000 cells mL−1 (103, 104, 105, 3 × 10⁵, 5 × 10⁵, 7 × 10⁵, 106, and 2 × 10⁶). Triplicated samples of each cell number were prepared for lipid analysis. Pellets of each cell number were collected into a 15-mL glass vial, and then freeze dried for analysis.
After analyzing lipid content using the SPV method, the lipid content data analyzed for each cell number was calculated using the standard curve, and the lipid content of individual cells was calculated. A t-test and ANOVA were performed to determine if the lipid content of individual cells has any significant difference with the lipid content of the individual cells calculated for each different cell number.
Preparation of 11 experimental organisms
We prepared nine dinoflagellates species including a benthic dinoflagellate (Ostreopsis cf. ovata) and a heterotrophic dinoflagellate (Oxyrrhis marina), and a chlorophyte, and a diatom species for comparison (Table 1). All cultures were grown at 20°C in enriched f/2-Si seawater media (Guillard and Ryther 1962) under a continuous illumination of 20 μE m−2 s−1 provided by cool white fluorescent lights except O. marina and diatom (f/2 media).
The phototrophic and mixotrophic species were grown in 2-L PC bottles containing 1 L of f/2-Si or f/2 media per a bottle. The cultures of each species were grown over a week until they ended exponential growth and entered stationary phase. The cell concentrations of these cultures were more than 3,000 cells mL−1. Aliquots of 10 mL were taken from each bottle and then fixed with Lugol’s solution in order to count their cell concentrations. Additionally, triplicate 50-mL aliquots were prepared for lipid content analysis using the SPV method.
O. marina was grown on dried yeast (Saccharomyces cerevisiae, Red Star; Lesaffre Yeast Corporation, St. Milwaukee, WI, USA) at 20°C. Yeast (0.1 g L−1) was supplied to the predator cells every day for 5 days, but not on the last day, in order to eliminate all yeast from the O. marina culture medium. After yeast removal, the samples were prepared for lipid quantification in the same manner as the other species.
The mean equivalent spherical diameter (ESD) was measured by an electronic particle counter (Coulter Multisizer II; Coulter Corporation, Miami, FL, USA).
Micro-colorimetric method using the SPV reaction
The direct measurement of lipid content using the SPV reaction in this study was modified from the Inouye and Lotufo protocol (Inouye and Lotufo 2006); in this method, 0.2 mL sample, 0.1 mL sulfuric acid, and 2.4 mL vanillin reagent (1.2 mg vanillin per milliliter of 68% phosphoric acid) were used.
For analysis of the lipid content of the 11 experimental species, triplicates of 50 mL samples were harvested using centrifugation at 3,500 rpm for 10 min. Pellets were rinsed with distilled water 2–3 times, and transferred into 15-mL glass centrifuge tubes. The pellets were freeze dried, and then 2 mL of a chloroform : methanol mixture (2 : 1 [v:v]) was added into the tubes, vortexing for 1 min for extraction. Subsequently, 1.5 mL of a 0.9% NaCl solution was added and the samples were centrifuged at 3,500 rpm for 15 s. The supernatant (methanol + 0.9% NaCl solution) was carefully removed, and 0.2–1 mL of the remaining materials (chloroform + extract) was transferred into a 4-mL glass vial. The vial was placed on the hot plate set at 90°C to allow the solvent to evaporate. Once the solvent was removed, 0.1 mL of concentrated sulfuric acid was added to each vial, and then heated at 90°C for 10 min until the color of sample changed to light brown. The vial was then removed from the hot plate and allowed to cool on ice for 5 min. Phospho-vanillin reagent (2.4 mL) was added and allowed to develop for 10 min, until the color of samples turned to pink. The absorbance was measured at 530 nm using a spectrophotometer (Jenway-7300; Bibby Scientific).
RESULTS AND DISCUSSION
The optical density measured using a spectrophotometer (and equivalent intensity of color) was significantly positively correlated with the known lipid content of the standard oil (i.e., Canola oil) (p < 0.01, linear regression ANOVA) (Fig. 1). Furthermore, the r2 value of the standard curve, which was obtained by plotting the optical density as a function of the lipid quantity, was 0.995.
When the lipid contents of the dinoflagellates A. minutum, P. micans, P. minimum, and L. polyedrum were calculated using the standard curve, the lipid amount of each species was also significantly positively correlated with optical density and equivalent intensity of color (p < 0.01 for each of all 4 species, linear regression ANOVA) (Fig. 2). Thus, when comparing color intensity or optical density of samples with these known color intensities or optical densities of each dinoflagellates species, the lipid content of the target species can be easily and rapidly quantified.
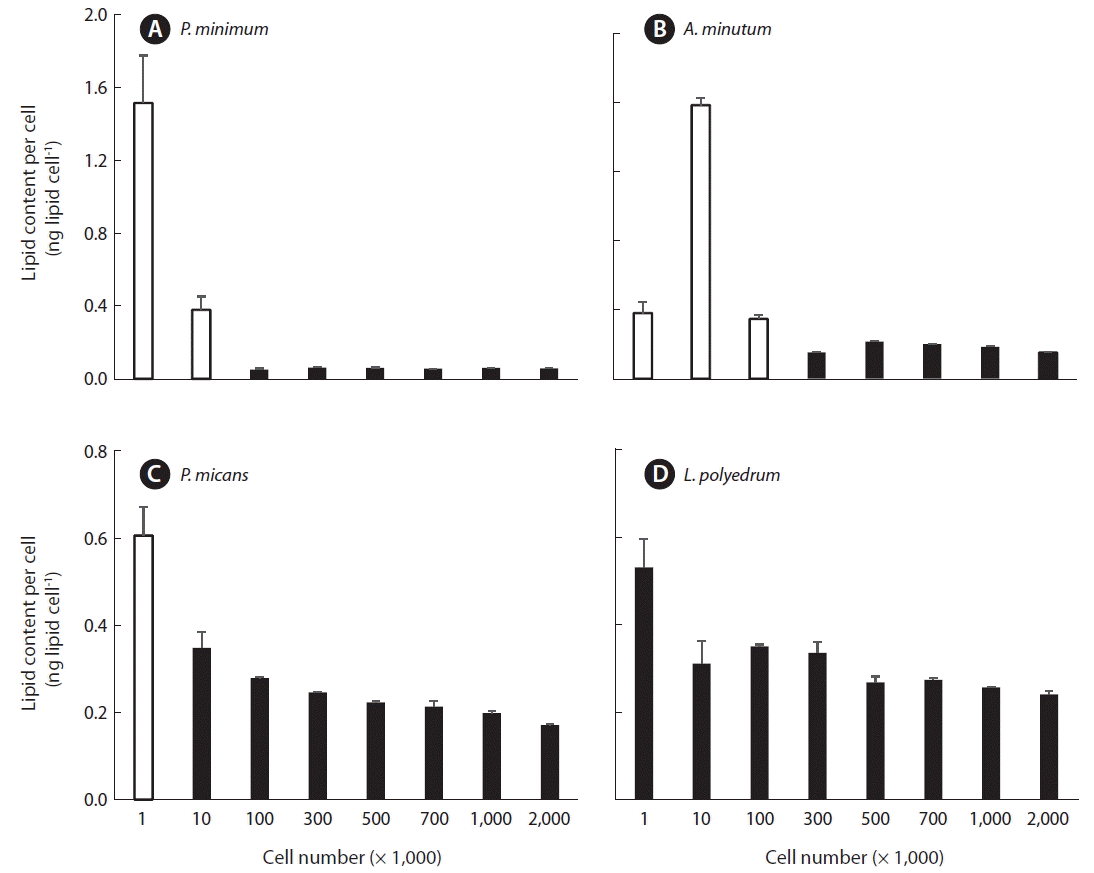
The lipid content per cell of P. minimum which was measured using 1 × 10³ or 1 × 10⁴ cells was significantly higher than that measured using the other 6 concentrations of cells (1 × 10⁵ to 2 × 10⁶; p < 0.01, one tailed t-test). However, the lipid content per cell for these 6 concentrations (1 × 10⁵ to 2 × 10⁶) were not significantly different from one another (p > 0.1, ANOVA) (Fig. 3A).
The lipid content per cell of A. minutum which was measured using 1 × 10³, 1 × 10⁴, or 1 × 10⁵ cells was significantly higher than those measured using the other 5 concentrations of cells (3 × 10⁵ to 2 × 10⁶; p < 0.01, one tailed t-test), however, the lipid content per cell for these 5 concentrations of cells (3 × 10⁵ to 2 × 10⁶) were not significantly different from one another (p > 0.1, ANOVA) (Fig. 3B).
The lipid content per cell of P. micans which was measured using 1 × 10³ cells was significantly higher than those measured using the other 7 concentrations of cells (1 × 10⁴ to 2 × 10⁶; p < 0.01, one tailed t-test), but the lipid contents per cell for these 7 concentrations of cells (1 × 10⁴ to 2 × 10⁶) were not significantly different from one another (p > 0.1, ANOVA) (Fig. 3C).
The lipid content per cell of L. polyedrum which was measured using 1 × 10³ cells was not significantly different from those measured using the other 7 concentrations of cells (1 × 10⁴ to 2 × 10⁶; p > 0.05, one tailed t-test), and the lipid contents per cell, which were measured using the 8 different concentrations cells (1 × 10⁵ to 2 × 10⁶), were not significantly different from one another (p > 0.1, ANOVA) (Fig. 3D). Therefore, when no more than 104 cells of A. minutum and P. minimum which are <20 μm in ESD cell size are analyzed, the lipid content per cell can be overestimated. Similarly, when no more than 103 cells of P. micans, which is 26 μm in ESD cell size, are analyzed, the lipid content per cell can be overestimated. However, when no less than 103 cells of L. polyedrum which is 38 μm in ESD cell size are analyzed, the lipid content per cell may not be overestimated.
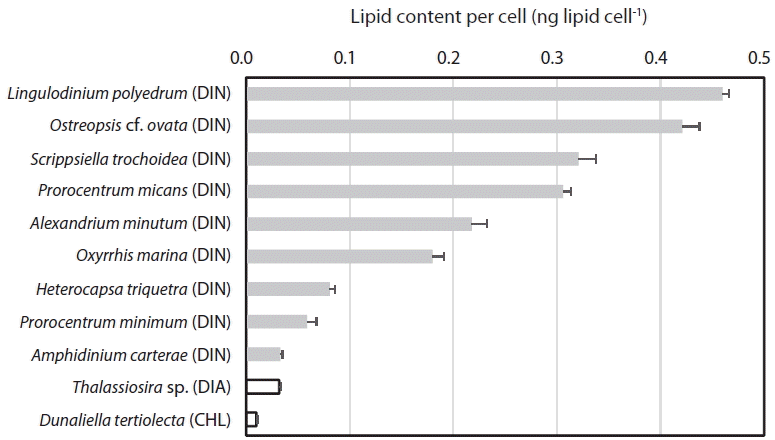
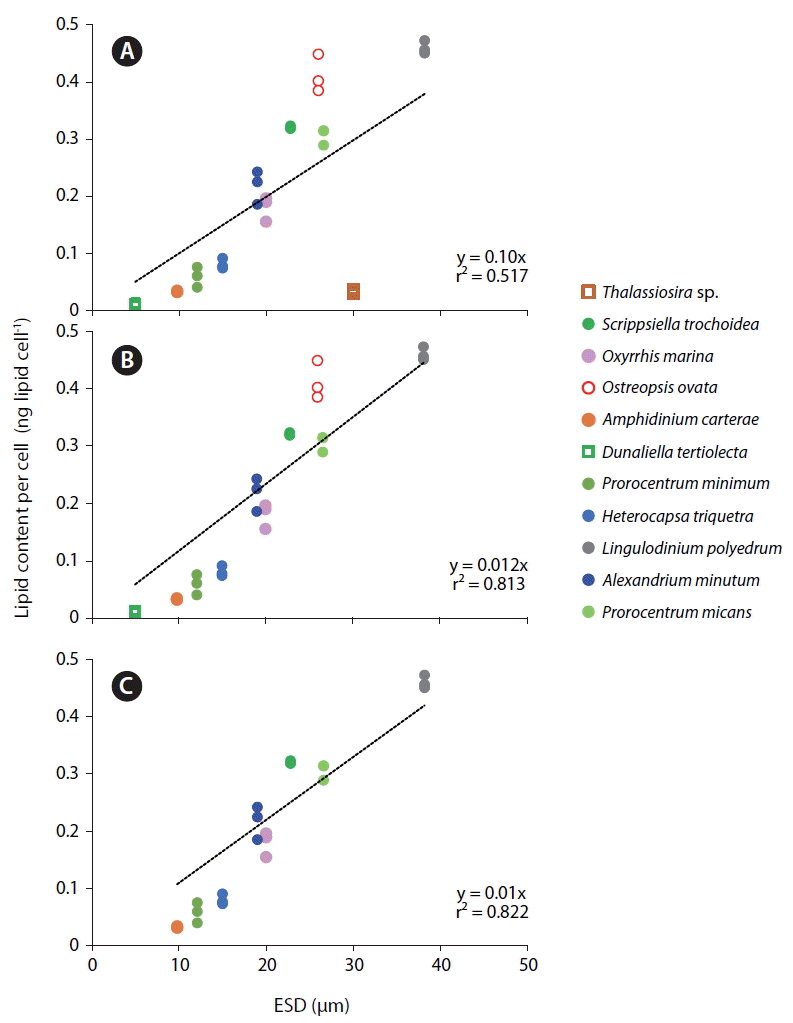
When the lipid content per cell of the 9 dinoflagellate species, a diatom, and a chlorophyte was analyzed using this method, the lipid concentration of L. polyedrum was highest (0.460 ± 0.012 ng lipid cell−1), while that of D. tertiolecta was lowest (0.010 ± 0.002 ng lipid cell−1) (Table 2, Fig. 4). The lipid content per cell of A. minutum measured using the SPV method in this study (0.186–0.345 ng lipid cell−1) was comparable to those measured using other methods (0.288–0.400 ng lipid cell−1) (Table 3). Thus, the SPV method is valid.
The lipid content per cell of the 11 microalgal species measured using SPV method increased with increasing the cell size (ESD, μm) with the exception of the diatom Thalassiosira sp. (Fig. 5A). This Thalassiosira sp. had a lipid content much lower than that of the dinoflagellates having similar sizes. The lipid content of all 11 microalgae species, 9 dinoflagellate species, or 8 planktonic species were significantly positively correlated with cell size with different values of r2 (Fig. 5B–D). The benthic dinoflagellate Ostreopsis cf. ovata had a lipid content approximately 25% higher than that of P. micans having a similar size (Fig. 5C).
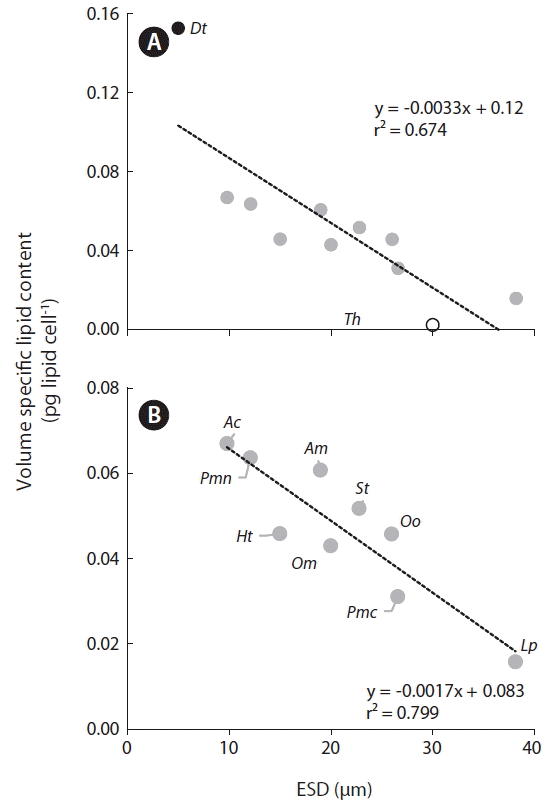
Among the tested species, the calculated volume of specific lipid content was highest for D. tertiolecta and lowest for Thalassiosira sp. (Fig. 6A). Among the dinoflagellate species tested, A. carterae had the highest volume specific lipid content, while L. polyedrum had the lowest. Furthermore, the volume specific lipid content of all dinoflagellates was significantly negatively correlated with cell size (Fig. 6B).
The conventional methods of quantifying the lipid contents of microalgae require large amounts of biomass and thus, usually requires a great deal of time and labor; the processing of samples for gas chromatography analysis may also take several days and be laborious work. The results of this study clearly show that both optical density and intensity of color had strong correlations with the lipid content of each of the 4 dinoflagellates tested and thus, the lipid content of a sample containing each species can be measured using spectrophotometry or even the naked eye. Thus, the SPV method applied in this study can be used as an easy and rapid method of quantifying the lipid content of microalgal species. The dry weight biomass of 105 cells of A. minutum and P. minimum are approximately 0.9 mg and 0.2 mg, respectively. These biomasses are much smaller than the minimum detectable biomasses in the Inouye and Lotufo method (2006), which were 10–50 mg. Therefore, the modified SPV method requires much less biomass than the method described by Inouye and Lotufo (2006).
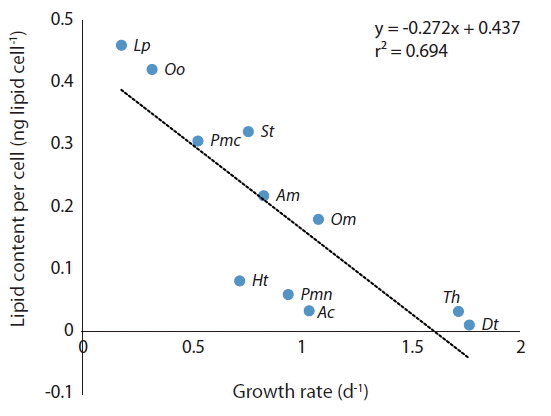
The lipid content of the diatom Thalassiosira sp. was much lower than that of P. micans which has a similar size, while that of the benthic dinoflagellate O. cf. ovata was much greater. The lipid content of the microalgae tested in this study is significantly negatively correlated with their growth rates (Fig. 7). Therefore, a high growth rate is likely to lower lipid content because lipids are a reserved material (Kagami and Urabe 2001, Converti et al. 2009). In addition, reserving lipids is likely to cause a low growth rate.
There have been many studies on the utilization of A. carterae as a source of raw materials for biofuel (Doan et al. 2011, Fuentes-Grünewald et al. 2016). Among the dinoflagellates tested in this study, A. carterae had the highest volume specific lipid content even though its absolute lipid content was lower than several other dinoflagellates. Thus, for the use of raw materials as biofuel, determining volume specific lipid content of a microalgae is important.
CONCLUSION
We applied a method of quantifying lipid content using SPV. In this method, the lipid content of a sample containing each species of dinoflagellates can be measured using spectrophotometry or the naked eye. Furthermore, when this method was used, only 1–3 × 10⁵ cells of P. minimum and A. minutum, 104 cells of P. micans, and 103 cells of L. polyedrum (approximately 1–5 mL of dense cultures) were needed to quantify lipid content per cell. The lipid content per cell of the 9 dinoflagellates tested was significantly positive correlated with cell size, but the volume specific lipid content per cell was negatively correlated with the cell size. Thus, this SPV method is an easy and rapid method of quantifying the lipid content of autotrophic, mixotrophic, and heterotrophic species of dinoflagellates.