


INTRODUCTION
The intertidal zone is one of the most productive ecosystems in the world (Hughes and Sherr 1983, Watermann et al. 1999). Benthic microalgae are ubiquitous in tidal flats and play major roles in coastal ecosystems. Microalgae contribute significantly to primary production, biomass generation, nutrient exchange via seawater and sediment interfaces, and sediment stabilization (Admiraal 1984, Yallop et al. 1994, Underwood and Barnett 2006). Many taxa are found in tidal flats, including diatoms, cyanobacteria, and euglenophytes; and sometimes dinoflagellates and chlorophytes (Meadows and Anderson 1968, Rejil 2013). Of these, diatoms are the most abundant, being the principal contributors to primary production and algal biomass in the intertidal zone (Admiraal 1976, Sullivan and Moncreiff 1988). Their ubiquitous distribution renders diatoms one of the most important groups of organisms of ocean ecosystems (Yallop et al. 1994, Mann et al. 2010).
Despite the importance of these taxa, knowledge on the diversity of benthic diatoms is limited. As samples from tidal flats contain a variety of organic matter and sedimentary particles, acid treatment is required prior to traditional morphological analysis (Baldi et al. 2011). However, this removes all organic material; we cannot tell whether frustules are those of living diatoms or dead diatoms deposited from overlying water. Furthermore, diatoms are traditionally identified and classified on the basis of morphological characteristics such as the cell shape, size, and the fine structure of the frustule. Thus, a great deal of time and effort are required for morphological identification and classification. Even experienced taxonomists may differ in their conclusions depending on their skill level and the keys that they follow. For these reasons, morphological data on benthic diatoms of tidal flats are lacking (Zimmermann et al. 2015).
Molecular-based approaches have emerged as useful alternatives to morphology-based approaches and are now widely used to study microorganisms. Molecular approaches based on polymerase chain reaction (PCR) such as denaturing gradient gel electrophoresis, analysis of terminal restriction length polymorphisms, and next-generation sequencing (NGS) render it possible to analyze microbial community structures in a time- and cost-effective manner (Visco et al. 2015). Of these techniques, NGS is the most powerful. Millions of DNA sequences are obtained, facilitating large-scale biodiversity analyses (Shokralla et al. 2012). In addition, a combination of NGS with DNA barcoding is synergistic when performing high-throughput biodiversity analyses (Hajibabaei et al. 2012). Recently, high-throughput sequencing using the 454 platform of 18S rRNA genes has been used to study diatom diversity (Kermarrec et al. 2013, 2014, Stief et al. 2013, Nanjappa et al. 2014, Visco et al. 2015, Zimmermann et al. 2015). However, very few studies have used NGS to study benthic diatoms (Visco et al. 2015). Further, the phylogenetic resolution afforded by benthic diatom 18S rRNA sequences is inadequate to identify diatoms to the species level (An et al. 2017).
Here, we developed a NGS technique to investigate the diversity of benthic diatoms. To improve taxonomic resolution, we designed primers specifically targeting the diatom rbcL gene and used these for MiSeq sequencing of samples from tidal flats of the Yellow Sea on the western coast of Korea. We studied diatom spatial distribution and identified factors regulating the distributions of various diatom lineages.
MATERIALS AND METHODS
Study site
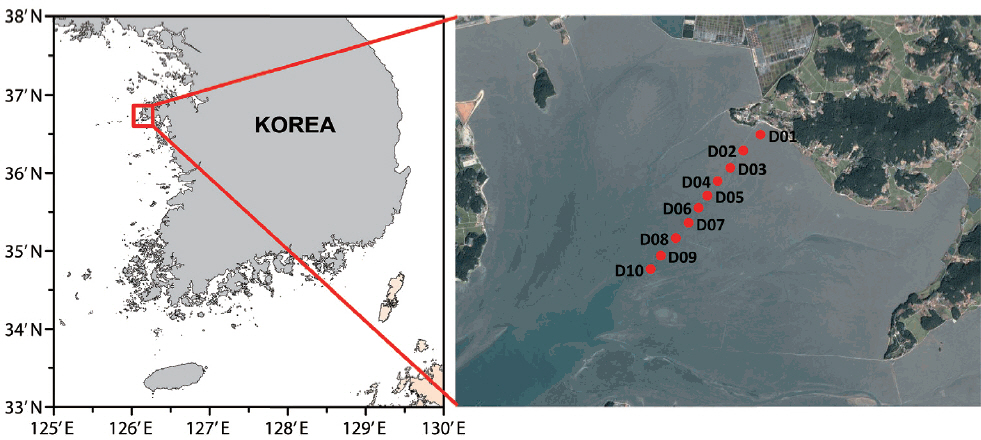
Sediment samples were collected from 10 tidal flats of the Guenso Bay of Taean on the west coast of Korea (Fig. 1). Guenso Bay is a semi-enclosed bay with an area of 87 km2, and the seawater flow is fan-shaped, similar to the shape of the bay. As no river flows into the bay, any influence of fresh water is minimal. The water depth is 2–4 m and the mean tidal difference 6 m. At low tide, about 90% of the total area is exposed; the mean exposure duration is 9.7 h per day. The water depth at high tide ranges from 1.4 to 4.7 m (Kim and Kim 2008).
Sample collection
Surface sediments were collected in October 2011 and January 2012 using a transparent acrylic corer (2 cm in internal diameter and 15 cm in length). As benthic diatoms tend to form heterogeneous mats on the surfaces of sediments, five replicate samples were collected at each station, immediately placed in an ice box, and transported in the cold to the laboratory. Five core samples from each station were extruded and the top 1-cm amounts of sediment pooled in one conical tube and thoroughly mixed. Samples for DNA extraction were obtained by subsampling the mixed sample and were stored in a deep freezer (−80°C).
Primer design
Diatom-specific primers targeting the rbcL gene were designed using the Primer3 (Untergasser et al. 2012) add-on of Geneious Pro v.5.3.6 software (http://www.geneious.com). The primers were designed by reference to an rbcL database containing 1,240 diatom sequences contained in GenBank and our in-house collection (An et al. 2017). After alignment of amino acid sequences, a degenerate primer pair was designed with consideration of amplicon size, specificity, and degeneracy. An appropriate annealing temperature was determined via thermal-gradient PCR using cultured strains and natural sediment samples as templates. To assess specificity, the PCR products of a natural sample were purified and cloned into the T-Blunt vector using the T-Blunt PCR Cloning Kit (SolGent, Daejeon, Korea). Cloned products were sequenced by Macrogen (Seoul, Korea) using an M13 primer and an automatic DNA sequencer (ABI Prism 377; Applied Biosystems, Foster City, CA, USA).
DNA extraction and PCR amplification for NGS
Genomic DNAs from 20 sediment samples were extracted using PowerSoil DNA isolation kits (MO BIO Laboratories Inc., Carlsbad, CA, USA) following the manufacturer’s protocol. The first PCR was performed using the novel diatom-specific primer pair, which amplified 431-bp rbcL fragments. The PCR conditions were: initial denaturation at 94°C for 5 min; followed by 25 cycles of amplification (95°C for 30 s, 56°C for 30 s, and 72°C for 45 s), and a final extension at 72°C for 10 min. Purification of the first PCR fragments and performance of the second PCR were as suggested in the MiSeq manual (Illumina 2013) and Choi et al. (2016). However, Ex-Taq polymerase (Takara, Ohtsu, Japan) was used for PCR reactions and the products were purified using Agencourt AMPure XP beads (Beckman Coulter, Brea, CA, USA). Each final purified DNA sample was quantified using a NanoDrop ND-1000 spectrophotometer (NanoDrop Technologies, Wilmington, DE, USA). Identical amounts of each PCR product were pooled and the mixed samples sequenced using the Illumina MiSeq 2 × 300 PE platform of Chun Lab (Seoul, Korea).
MiSeq data analysis
We constructed a reference database composed of 2,240 rbcL gene sequences from Bacillariophyta Engler & Gilg, 1919 and two rbcL gene sequences from Ochrophyta Cavalier-Smith, 1995 using sequences from GenBank and those of strains isolated in a previous study (An et al. 2017). DNA alignment of rbcL genes was based on alignment of amino acids translated from the DNA, using the ARB package (Ludwig et al. 2004). Incorrect sequences and those with nonsense codons were excluded.
The sequences were processed using the Mothur package v.1.33.3 (http://www.mothur.org/) (Schloss et al. 2009) following the standard MiSeq operating procedure. Pairs of fastq files were first assembled into contigs using the ‘contig.seqs’ command and screened to remove poor-quality sequences employing the ‘screen.seqs (minlength = 400, maxlength = 525, maxambig = 0, maxhomop = 8)’ routine. All sequences were translated into amino acid sequences to allow removal of nonsense codons using the Jemboss program v.1.5 (http://emboss.sourceforge.net/Jemboss/) (Carver and Bleasby 2003). Such sequences were removed by the ‘remove.seqs’ command of the Mothur package. Next, single representative sequences selected by the ‘unique.seqs’ command were aligned to the diatom reference database with the aid of the ‘align.seqs’ procedure. PCR artifacts and chimeras were removed using the ‘pre.cluster (diffs = 4)’ and ‘chimera.uchime (dereplicate = t)’ commands, respectively. The remaining sequences were classified with the aid of the ‘classify.seqs (method = knn, numwanted = 1)’ command employing the reference database. The number of reads of each sample was confirmed by ‘count.group’ command. To normalize the number of reads in each sample to sample with the smallest number of reads, all reads were randomly subsampled by the ‘sub.sample (size = 9,236)’ command of the Mothur package. To build the operational taxonomic unit (OTU) matrix, a distance matrix was generated using the ‘dist.seqs (cutoff = 0.20)’ command. Next, the sequences were clustered into OTUs based on the distance matrix employing the ‘cluster (with cutoffs ranging from 0.01 to 0.06)’ command using the opticlust algorithm. Each OTU shared file was generated at each cutoff value using the ‘make.shared (labels = from 0.01 to 0.06)’ command and used to estimate the number of OTUs and species at each identity level. Finally, representative OTU sequences were generated using the ‘get.oturep (method = abundance)’ command. The alpha diversity was calculated employing the ‘summary.single (calc = nseqs-coverage-sobs-ace-chao-shannon-simpson, subsample = 9,236)’ command. The sequences obtained in this study were deposited to the National Center for Biotechnology Information of the US National Library of Medicine (NCBI) sequence read archive (SRA, https://trace.ncbi.nlm.nih.gov/Traces/sra/; accession number SRP126754).
Phylogenetic analysis
OTU taxonomic assignments were checked by performing phylogenetic analyses. Maximum-likelihood (ML) trees of sequences representing major OTUs were constructed using Randomized Axelerated Maximum Likelihood v.8.2.1 software (RAxML) (Stamatakis 2014). Two Ochrophyta species [Triparma pacifica (Guillou & Chrétiennot-Dinet) Ichinomiya & Lopes dos Santos and Triparma mediterranea (Guillou & Chrétiennot-Dinet) Ichinomiya & Lopes dos Santos] served as the outgroup. We used the “-f a” option for rapid bootstrap analysis and the best likelihood tree search employing “-# 100” and the default settings (i.e., “-m GTRGAMMA”) of the substitution model with rate heterogeneities “-i” for the automatically optimized subtree pruning and regrafting rearrangement (heuristic search) and “-c” for each of the 25 distinct rate categories. A heat map containing the ML tree was generated and the relative abundance of each OTU displayed using the Interactive Tree Of Life (http://itol.embl.de) (Letunic and Bork 2007).
Other analyses
Sediment temperature was measured using a thermometer with a stainless steel probe. The exposure time of each station on the tidal flat was calculated using the digital elevation model and tidal data, as described by Choi et al. (2011). Samples for measurement of chlorophyll a (Chl-a) concentration, water content, and grain size were stored in pre-weighed 15-mL tubes and immediately frozen. Sediment samples were dried using a freeze-dryer (FDU-1200; Eyela Co., Tokyo, Japan) and water contents calculated by comparing weights before and after freeze-drying. Chl-a was extracted into 95% (v/v) acetone for 24 h, the samples filtered through 0.2-μm-pore-sized hydrophobic syringe filters, and Chl-a levels were measured using the method of Parsons et al. (1984) employing a Turner 10-AU fluorometer (Turner Designs, San Jose, CA, USA) and converted to mass per unit area (mg m−2) by reference to the cross-sectional area of the corer. Sediment samples were pretreated prior to particle size analysis. To remove organic matter and carbonate (CaCO3), 30% (v/v) hydrogen peroxide was added to sediment samples followed by 24 h of incubation on a hot plate (about 80°C); 10% (v/v) hydrochloric acid was then added and the mixture incubated for an additional 24 h on the hot plate. Each sample was washed three times over three days with deionized distilled water. The grain sizes of the sediment samples were then analyzed using a laser diffraction method (Mastersizer 3000 grain size analyzer; Malvern Instruments, Ltd., Worcestershire, UK). Each sample was analyzed in triplicate, and the mean of the three measurements calculated. Ultrasound was applied during analysis to prevent clumping. The size distributions and statistical parameters were calculated using GRADISTAT v.8.0 software (http://www.kpal.co.uk/gradistat.html) (Blott and Pye 2001). Canonical correspondence analysis (CCA) comparing the proportions of major diatom genera and six environmental factors was conducted with the aid of CANOCO (CANOnical Community Ordination v.4.5) software (Ter Braak and Smilauer 2002). In this analysis, the relative proportions of diatom genera were square-root transformed and all variables excluding grain size were log(x + 1)-transformed.
RESULTS AND DISCUSSION
Primer design and specificity
Various DNA regions within nuclear, mitochondrial, and chloroplast genes have been used for the phylogenetic analysis of diatoms (Moniz and Kaczmarska 2010). Previous studies focused principally on ribosomal RNA (i.e., 18S rDNA and 28S rDNA). In particular, 18S rDNA has been extensively used and a database containing a relatively large number of sequences has been constructed (Beszteri et al. 2001, Jones et al. 2005, Sato et al. 2008). However, 18S rDNA affords only low-resolution discrimination of diatom species (Theriot et al. 2009, Mann et al. 2010, Zimmermann et al. 2011, 2015, Kermarrec et al. 2013, An et al. 2017). Although long 18S rRNA gene fragments can be used to identify diatoms to the species level, resolution falls off rapidly with shorter sequences and, moreover, the long-branch attraction artefact of certain diatom species compromises the utility of 18S rDNA sequences in terms of studying benthic diatom diversity (Bruder and Medlin 2008, An et al. 2017). Furthermore, long read sizes are not appropriate when employing NGS. Therefore, alternative genes such as those encoding the ribulose-1,5-bisphosphate carboxylase large subunit (rbcL), the cytochrome c oxidase subunit I (coxI), the internal transcribed spacer, photosystem II protein D1 (psbA), and ribulose-1,5-bisphosphate carboxylase small subunit (rbcS) have been proposed as alternative genetic markers affording better resolution than 18S rRNA (Ehara et al. 2000, Amato et al. 2007, Evans et al. 2007, Roer 2008, Moniz and Kaczmarska 2010, Trobajo et al. 2010, Delaney et al. 2011, Zimmermann et al. 2011, Kermarrec et al. 2013, An et al. 2017). For NGS analysis, the most important thing is to build a good database. However, the number of sequences for diatoms genes seems to be insufficient. The number of sequences registered in GenBank is 6,624 for 18S rDNA, 4,072 for rbcL, 3,305 for 28S rDNA, and 539 for coxI. Considering the resolution, the number of available sequences, ease of alignment and low risk of contamination by fungi or bacteria (Evans et al. 2007, MacGillivary and Kaczmarska 2011), we selected the rbcL gene as a molecular marker for MiSeq analysis.
We designed a primer pair by reference to the rbcL sequence database; we sought specificity for benthic diatoms and a fragment size of ca. 450 bp. The two degenerate primers were as follows: forward: DrbcL265_F, 5′-TAYCGYGTAGATCCAGTTCCA-3′; and reverse DrbcL695_R, 5′-GCACGRTTRATASCTTCCAT-3′.Insilicoanalysis showed that the primers well-matched the sequences of most pennate diatoms, including the most common benthic diatoms (Table 1). When one mismatch was allowed, the primers targeted most diatom sequences of the three predominant benthic orders (Naviculales, Bacillariales, and Thalassiophysales) (Round 1971, Underwood 1994, Cibic et al. 2007) suggesting that the primer pair could be used to study the diversity of benthic diatoms. However, the primers poorly matched the sequences of centric diatoms which are mainly planktonic (Table 1), indicating that the primers should be applied cautiously in studies on planktonic diatom diversity.
PCR-cloning/sequencing supported the idea that the primers were specific for benthic diatoms. All 17 clones from a tidal flat sample were assigned to the diatom rbcL sequence by blastn (GenBank), with sequence identities of 92–99% compared with the closest diatom strains (Supplementary Table S1).
OTU assignment and classification of reads
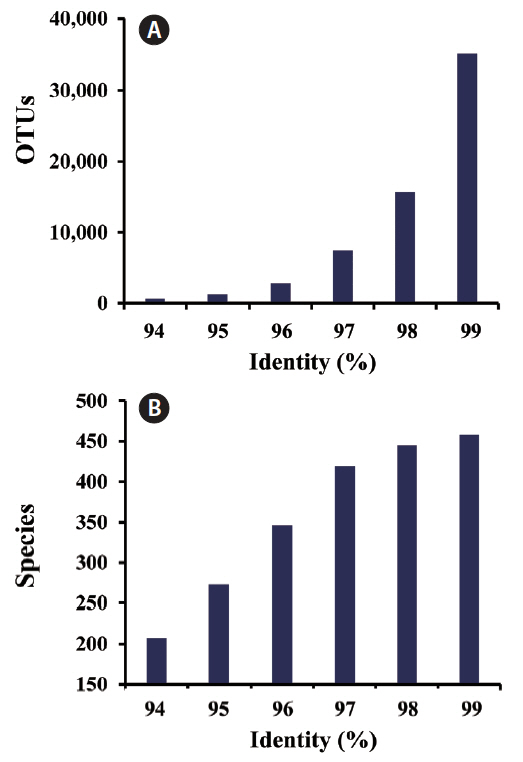
The criterion used to separate OTUs is important when it is sought to understand diatom composition and diversity. In general, a 98.7% similarity level of the 16S rRNA gene serves as the threshold defining OTUs at the prokaryote species level (Yarza et al. 2014). However, no consensus criteria in terms of diatom clustering at the species or genus level are available. Nanjappa et al. (2014) analyzed diatom diversity and distribution by clustering OTUs at the 97% identity level employing pyrosequencing of the V4 and V9 regions of small subunit rDNA. Zimmermann et al. (2015) compared pyrosequencing data from 18S V4 diatom regions by clustering OTUs at 98% identity in terms of the traditional morphological classification. With rbcL, Hamsher et al. (2011) reported that inter-species sequence divergences in the genus Sellaphora Mereschowsky, 1902 were very low, ranging from 0.14 to 0.73%. Using a mock community of known freshwater diatoms, Kermarrec et al. (2014) suggested that a 99 and 98% rbcL gene sequence similarity could be used as a clustering threshold at the species and genus level, respectively.
However, recent work showed that the inter-species distances of rbcL genes within the predominant genera of tidal flats ranged from 0.021 to 0.078 (An et al. 2017), suggesting that rbcL variation is relatively large among benthic diatom species. In the present study, we estimated the numbers of OTUs and species at different identity proportions (94–99%) of rbcL sequence (Fig. 2). The number of OTUs increased exponentially as the threshold increased. However, the number of species tended to become saturated at identity levels over 98%, indicating that 98% was a conservative threshold when used to discriminate species. Therefore, we used 98% rbcL sequence similarity for diversity analyses at the species level.
The Mothur program features two methods for classifying reads and assigning taxonomy. One is the k-Nearest Neighbor (k-NN) algorithm used in the present study and the other is the Wang approach. The latter method is implemented by the Ribosomal Database Project classifier (Wang et al. 2007), which analyzes communities in a very reliable manner using a statistical approach termed the Bayesian method. However, when using the Wang approach, more than half of all reads could not be classified even to the genus level, probably because the genetic diversity of benthic diatoms is very poorly understood; the taxonomic information in the database is inadequate (data not shown). Therefore, all reads were classified by reference to the closest database relationship evident using the k-NN algorithm. Next, the classification of the major OTUs was confirmed by phylogenetic analysis to overcome any possible inaccuracies (Jiang et al. 2012). We found some mismatches between the tree-based approach and the k-NN algorithm output; we corrected the classifications of the major OTUs as revealed by the k-NN algorithm by reference to the phylogenetic analyses.
Richness and diversity of benthic diatoms as revealed by the MiSeq approach
To explore the utility of the MiSeq platform when studying the diversity of benthic diatoms, we sequenced 20 samples using the newly designed primers and obtained 972,664 raw reads of an average length of 431 bp (Supplementary Table S2). After removal of low quality/erroneous reads and chimeras, 384,646 reads with 431 bp in length remained. Because the number of reads obtained from each sample ranged from 9,246 to 38,793, the reads were subsampled to normalize the number of sequences in each sample (9,246 reads). In total, 15,655 OTUs were generated after clustering at the 98% similarity level and 103 OTUs exhibited relative frequencies of 1% or more. Diversity indices and number of OTUs for each sample shown in Table 2. The number of OTUs differed greatly (four-fold) between October and January. Shannon indices in this study ranged from 4.6 to 6.1. There are no previous studies on benthic diatoms, especially using molecular techniques, in tidal flats adjacent to this study area. However, the observed diversity was much higher than benthic algal diversities (1.0–3.3), which were estimated for benthic algae on the basis of microscopic observation, found in other tidal flats (Choi 2002, Yoo 2004, Park et al. 2013). This suggests that traditional morphology-based analysis techniques could significantly underestimate the benthic algal diversity. The richness indices (ACE and Chao1) were also much higher (10- to 20-fold) in January than in October, suggesting large seasonal variations in benthic diatom compositions. The spatial variations in the richness and diversity indices were relatively small compared to the temporal variation. Despite the pronounced seasonal variation, the high-level richness of benthic diatoms suggests that a large proportion of benthic diatom diversity has not yet been explored.
Spatio-temporal variation in benthic diatom levels
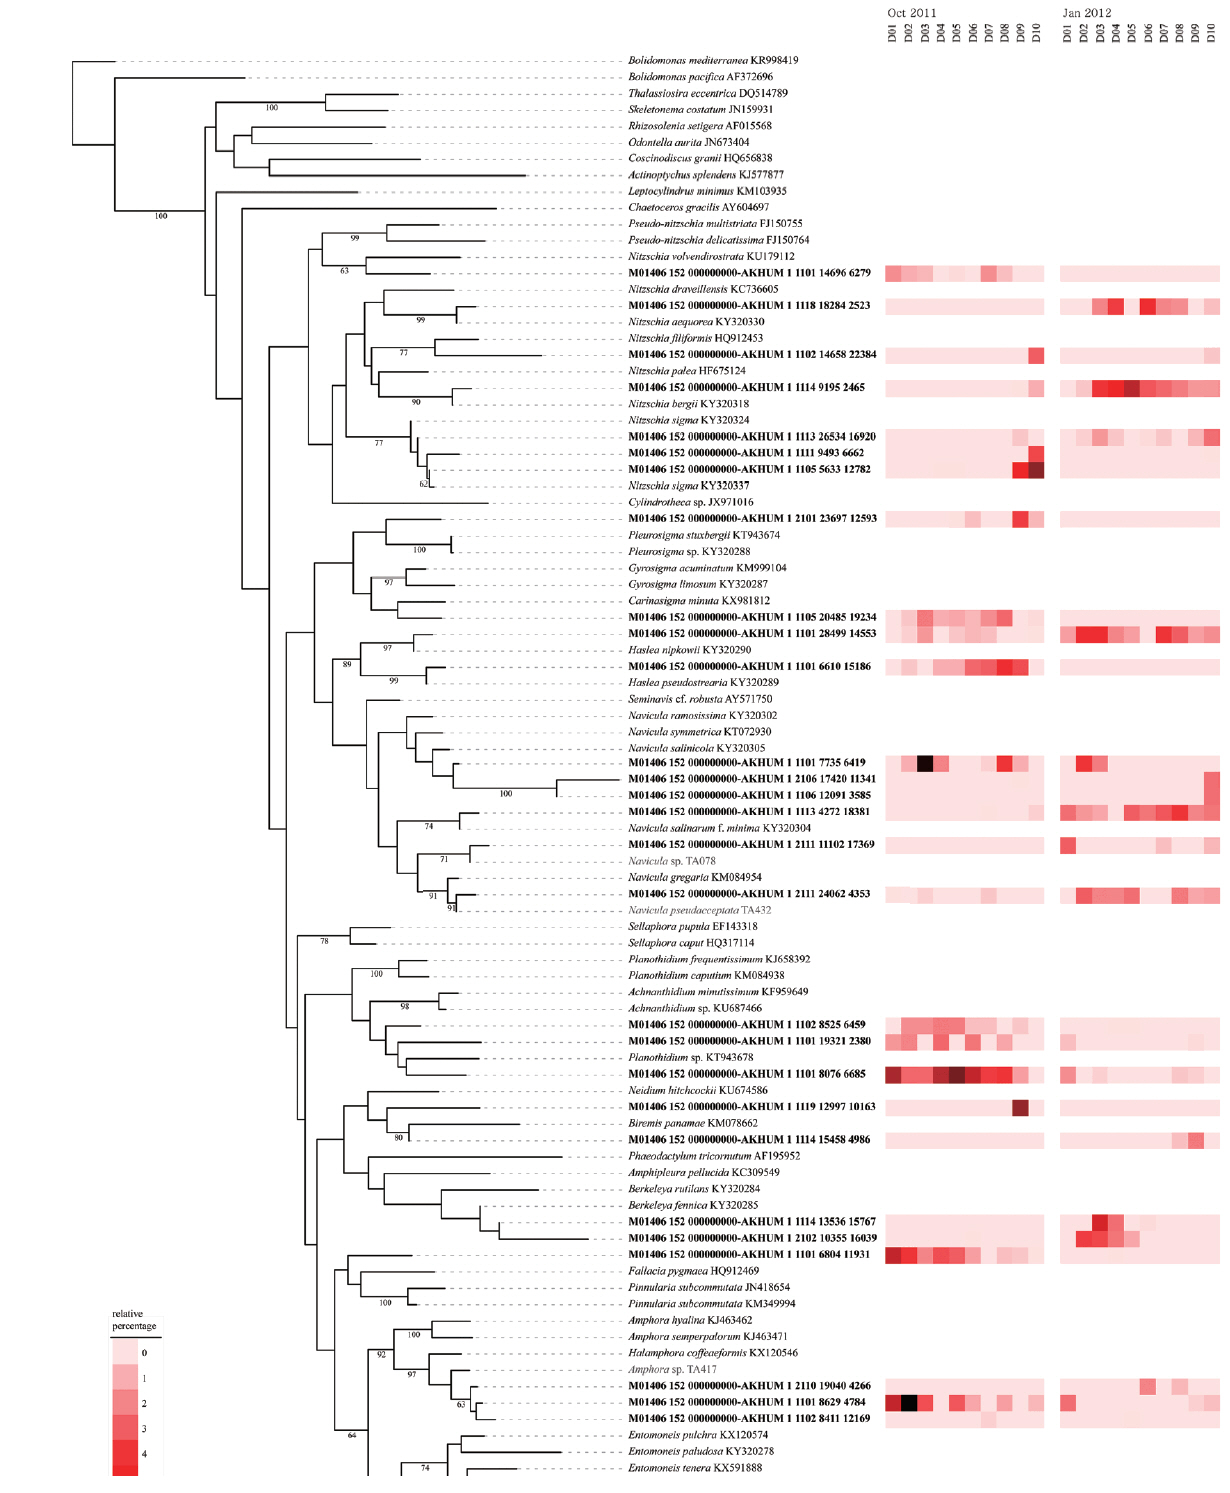
The OTUs obtained in the present study clustered into 3 classes, 30 orders, 57 families, 140 genera, and 445 taxa excluding organisms considered incertae sedis (e.g., genus Schizostauron Grunow, 1867). The OTUs associated with Nitzschia, Navicula, Amphora Ehrenberg ex Kützing, 1844, and Planothidium Round & L. Bukhtiyarova, 1996 predominated in tidal flats, but the particular OTU in differed among the samples, suggesting that the distribution of benthic diatoms was highly heterogeneous in terms of both time and space (Fig. 3).
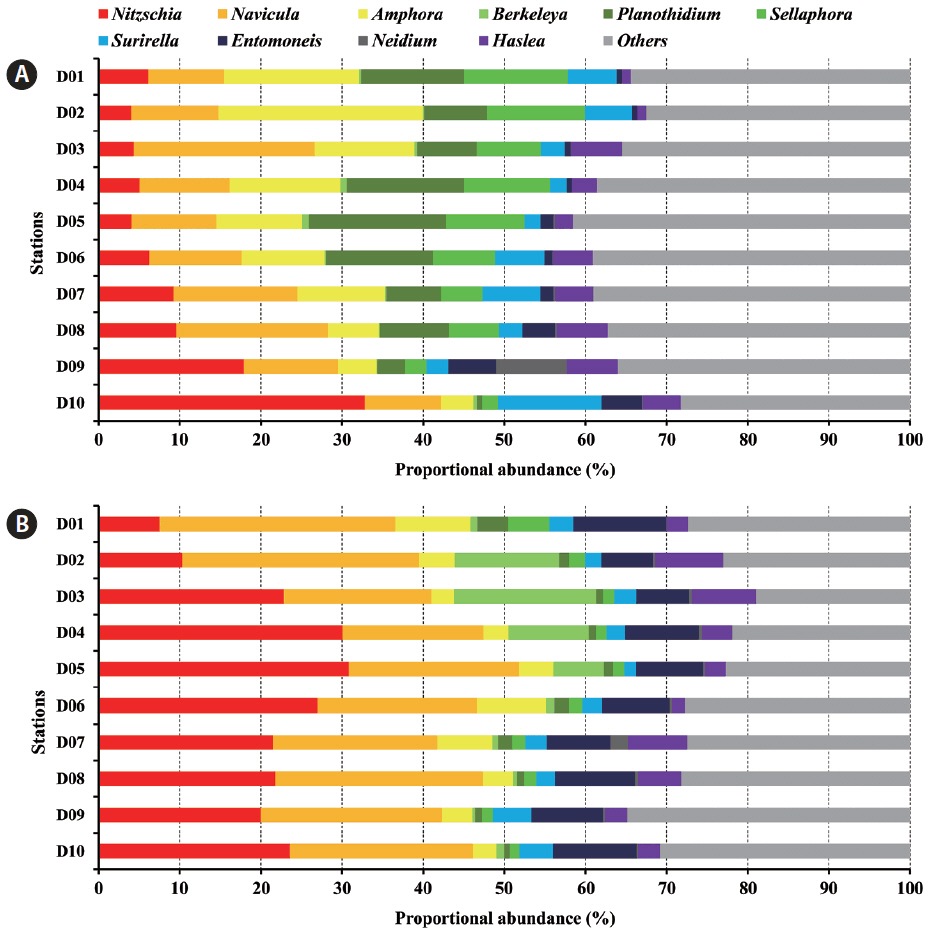
Interestingly, the 10 most abundant diatom genera constituted over 60% of all diatom communities and exhibited distinct spatio-temporal variations (Fig. 4). Several genera including Nitzschia, Navicula, Amphora, Berkeleya Greville, 1827, Planothidium, Sellaphora, and Surirella Turpin, 1828 were predominant in October and January. However, Nitzschia and Navicula overwhelmingly dominated tidal flats in January. Spatial variation in terms of generic distribution was evident. In October 2011, Navicula and Amphora generally predominated at most stations, but Nitzschia was the most common organism in the low-intertidal areas. In addition, Planothidium and Sellaphora levels tended to decrease toward the sea. In January 2012, the relative Berkeleya proportion tended to fall in the low-intertidal area. Thus, several environmental factors regulated spatial distribution (see below).
The major benthic diatoms of tidal flats of Guenso Bay were Navicula, Nitzschia, and Amphora. Similarly, Nitzschia and Navicula were present at relatively high levels during winter in the Geum Estuary of Korea (Kim and Cho 1985) and Amphora was a major diatom group in Marennes-Oléeron Bay (Haubois et al. 2005). Benthic diatoms adhere to a variety of substrates, including mud, sand, stones, plants, algae, and animals (Zimmermann et al. 2015). Diatoms inhabiting tidal flats are mostly epipelic or episammic. Amphora, Navicula, and Nitzschia are epipelic diatoms with raphes on both sides of the frustule, allowing them to live freely in mud (Round 1971). As the diatoms can move with the aid of an extracellular polymer secreted by the raphe, they grow in coastal environments wherein sediments are continuously deposited and extreme environmental changes occur periodically (Kwon et al. 2012). Therefore, Amphora, Navicula, and Nitzschia are major taxa of tidal flats worldwide (Round 1971, Dijkema and Wolff 1983, Underwood 1994, Hamels et al. 1998, Cibic et al. 2007, Lee 2013).
The relative frequency might not be consistent with the proportion of absolute abundances of taxa considering the putative PCR efficiency. However, the primer pair used in this study shows similar good coverage for dominant taxa in the tidal flats, indicating that the efficiency problem would not be significant in major benthic diatom groups.
Environmental factors affecting the distributions of benthic diatom genera
To assess environmental factors associated with the spatio-temporal distributions of diatom genera, we subjected benthic diatom assemblages and environmental factors (Table 3) to CCA analysis (Fig. 5). As a result of CCA analysis, we found that grain size, sand percentage, and exposure time all significantly influenced diatom distribution. The variation of benthic diatom assemblages could be accounted for 90.9% by the first two axes (70.8% for first axis and 20.1% for second axis), and the factors that have the largest influence on the community structure were the percentage composition of sand, followed by sediment grain size. De Sève et al. (2010) noted that the relative frequencies of epipelic and episammic species were closely associated with sediment grain size. The relative frequencies of the major genera correlated significantly with sediments of particular sizes. Oh et al. (2009) reported that Nitzschia grew best when the diameter of the attachment substrate was 90–150 μm (the smallest particle used in the experiments); the smaller the particle size, the higher the growth rate and biomass. In the present study, the proportions of Nitzschia and Entomoneis correlated principally (and positively) with the level of muddy sediment. On the other hand, Amphora levels correlated positively with the proportion of sand, consistent with the finding of a previous study to the effect that Amphora predominated when the particle diameter was about 250 μm (Mitbavkar and Anil 2002).
Applicability and limitations of NGS when studying diatoms
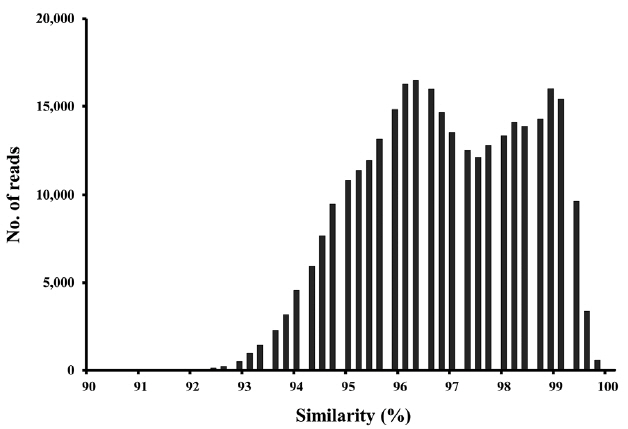
Application of molecular techniques to identify benthic diatoms has obvious advantages, but also several limitations. The extent of taxonomic coverage by a reference database is important in terms of sequence classification (Kermarrec et al. 2013). Although the number of rbcL sequences in the database is relatively greater than those of other protein-encoding genes (except the ribosomal proteins), many of our OTUs lacked close database relatives (Fig. 6). Considering that the estimated species richness was ca. 30,000 in the present study, and the fact that diatoms may feature up to 100,000 species (Mann and Vanormelingen 2013), the database of 2,200 sequences used in the present study is grossly inadequate in terms of thorough phylogenetic analyses. Therefore, continued efforts must be made to expand and improve the database (Visco et al. 2015, Zimmermann et al. 2015).
CONCLUSION
Elucidation of benthic diatom diversity remains challenging. In this study, we developed an amplicon-sequencing technique for the rbcL gene, using a novel primer set specifically targeting benthic diatoms and the MiSeq high-throughput sequencing platform. This allowed us to estimate diversity indices and explore the spatio-temporal variability of species and environmental factors moderating spatial distribution. The high-level richness of benthic diatoms suggests that a large proportion of such diatoms remains unknown and efforts to reveal the hidden diversity are required. In addition, further studies would increase the quantity and quality of database information, improving the accuracy of future sequence classifications.