


INTRODUCTION
Sargassum is attached to the rocky bottom in the coastal ocean, but is detached from the floor by strong waves or currents from winter to spring (Yoshida 1963, Komatsu et al. 2007). Sargassum can float after detaching from the bottom because of vesicles filled with gas. The detached Sargassum floats and drifts away from its original habitat. Pelagic Sargassum aggregates and forms drifting rafts that provide habitat for fish, crabs, shrimp, and birds (Cho et al. 2001, Komatsu et al. 2007). Accompanying organisms can disperse with floating macroalgae, which serve as a means for moving intertidal animal species and marine invertebrates to great distance (Ingólfsson 1995, Thiel 2003, Clarkin et al. 2012).
The origin of drifting Sargassum patches in the East China Sea (ECS) has been thought to be geographically limited around the Chinese coast in the ECS (Filippi et al. 2010, Zhang et al. 2019). Beaching of pelagic Sargassum has been reported along the Taiwanese coast and Japanese coast and pelagic Sargassum has been observed from research vessels between the Kuroshio and the coastal waters in the ECS (Komatsu et al. 2007, Mizuno et al. 2014). Drifting Sargassum was observed in the area where sea surface temperature (SST) was between 20 and 24°C, and SST in the Kuroshio was above 24°C on May 8–22, 2002 (Komatsu et al. 2007). Floating Sargassum patches were observed mainly on the continental shelf west of the Kuroshio between 26° N and 30° N from late winter to early spring in 2010 and 2011 (Mizuno et al. 2014).
After the start of satellite remote sensing over the ECS and Yellow Sea (YS), floating brown macroalgae rafts or aggregated patches in the ECS were first observed in satellite images from March to May 2012 and February to May 2013 (Kim et al. 2019). Floating brown marcroalgae patches were observed by the satellite sensors in the eastern YS and along the southwest coast of Korea from March to May 2015. Satellite observations can provide snapshots over a wide area (Zhang et al. 2019). However, satellite remote sensing is often hampered by weather conditions, such as clouds and sea fog. Satellite imagery may only partially capture the distribution of pelagic macroalgae because of cloud cover. On a clear day, satellites may capture the whole pattern of the pelagic macroalgae in the ECS and YS.
Lagrangian particle tracking models are useful in determining the sources, trajectories, and destinations of drifting macroalgae (Lee et al. 2011, Son et al. 2015, Brooks et al. 2018, Choi et al. 2018, Putman et al. 2018, Wang et al. 2019). Transport of green algae in the YS was simulated for May and June 2008 (Lee et al. 2011) and for June and July 2011 (Son et al. 2015). However, few transport pathway simulations of pelagic Sargassum in the ECS and YS have been reported, and particle tracking simulations of pelagic Sargassum in the ECS were conducted without accounting for the windage (leeway) effect (Filippi et al. 2010, Qi et al. 2017).
To estimate the best trajectory of pelagic Sargassum using a Lagrangian particle tracking model, accurate initial distribution of the macroalgae patches is essential. The Lagrangian particle tracking model can fill missing parts of Sargassum patches in the satellite images captured on cloudy days using an accurate distribution of the pelagic Sargassum patches in satellite images captured on a clear and fair weather day. The size of massive floating Sargassum in May 2017 was the largest ever in the ECS and YS (Qi et al. 2017, Kim et al. 2019). However, Lagrangian particle tracking simulation has not been previously conducted for the largest brown macroalgal bloom of May 2017 in the ECS and YS.
The primary objective of this study was to trace the trajectories of pelagic Sargassum patches in May 2017 in the ECS and YS using satellite remote sensing data and Lagrangian particle tracking simulations. The missing parts of pelagic Sargassum patches in satellite images could be restored by forward and backward particle tracking, which enabled us to see an entire sequence of floating Sargassum patch migration and to identify the destinations and source regions in the ECS and YS. The secondary objective was to determine the physical factors that drove the northward intrusion of the massive Sargassum patches into the YS in May 2017.
MATERIALS AND METHODS
Satellite remote sensing data
Geostationary Ocean Color Imager (GOCI) data were used to analyze the distribution and migration of floating macroalgae in the ECS and YS in May 2017 (Ryu et al. 2012). GOCI images were corrected by removing the molecular (Rayleigh) scattering effects using the GOCI Data Processing System (GDPS). After cloud and sun-glint were removed from the satellite images, the normalized difference vegetation index (NDVI) algorithm was applied to detect floating macroalgae:
, where NIR is the near infrared band reflectance, and RED is the red band reflectance. Pixels with NDVI values above 0 are recognized as floating macroalgae (Kim et al. 2018).
It was difficult to clearly distinguish the reflectance spectra of green and brown macroalgae in satellite images (Hu et al. 2015, Kim et al. 2019). We distinguished brown macroalgae (Sargassum sp.) from green macroalgae (Ulva sp.) in three steps. In the first step, the NDVI algorithm was applied to detect floating algae. The second step was to mask all pixels except those classified as floating algae. Finally, only the pixels classified as floating algae were composited into true-color images to identify green and brown macroalgae.
Daily SST data were obtained from the Operational Sea Surface Temperature and Sea Ice Analysis (OSTIA) dataset produced by the UK Met Office. The OSTIA SST dataset is a global gridded gap free dataset. The OSTIA SST data were used for model validation and data assimilation.
Regional Ocean Modeling System
For the ocean circulation model of the ECS and YS, the Regional Ocean Modeling Systems (ROMS) was used in this study (Haidvogel et al. 2000). The ROMS is a three-dimensional, free surface, primitive equation, finite-volume numerical model (Song and Haidvogel 1994, Lee et al. 2011, Kwon et al. 2016). For the heat exchange between the sea surface layer and the atmosphere, the sensible heat flux, latent heat flux, and upward longwave radiation were calculated using the bulk formula in the model (Fairall et al. 2003). For the vertical coordinate, the s-coordinate was used, which is a combination of the geopotential z-coordinate and the sigma-coordinate, to provide improved vertical resolution near the sea surface and the seafloor (Song and Haidvogel 1994, Shchepetkin and McWilliams 2005). The vertical mixing was parameterized according to the Mellor and Yamada level 2.5 closure scheme (Mellor and Yamada 1982, Durski et al. 2004).
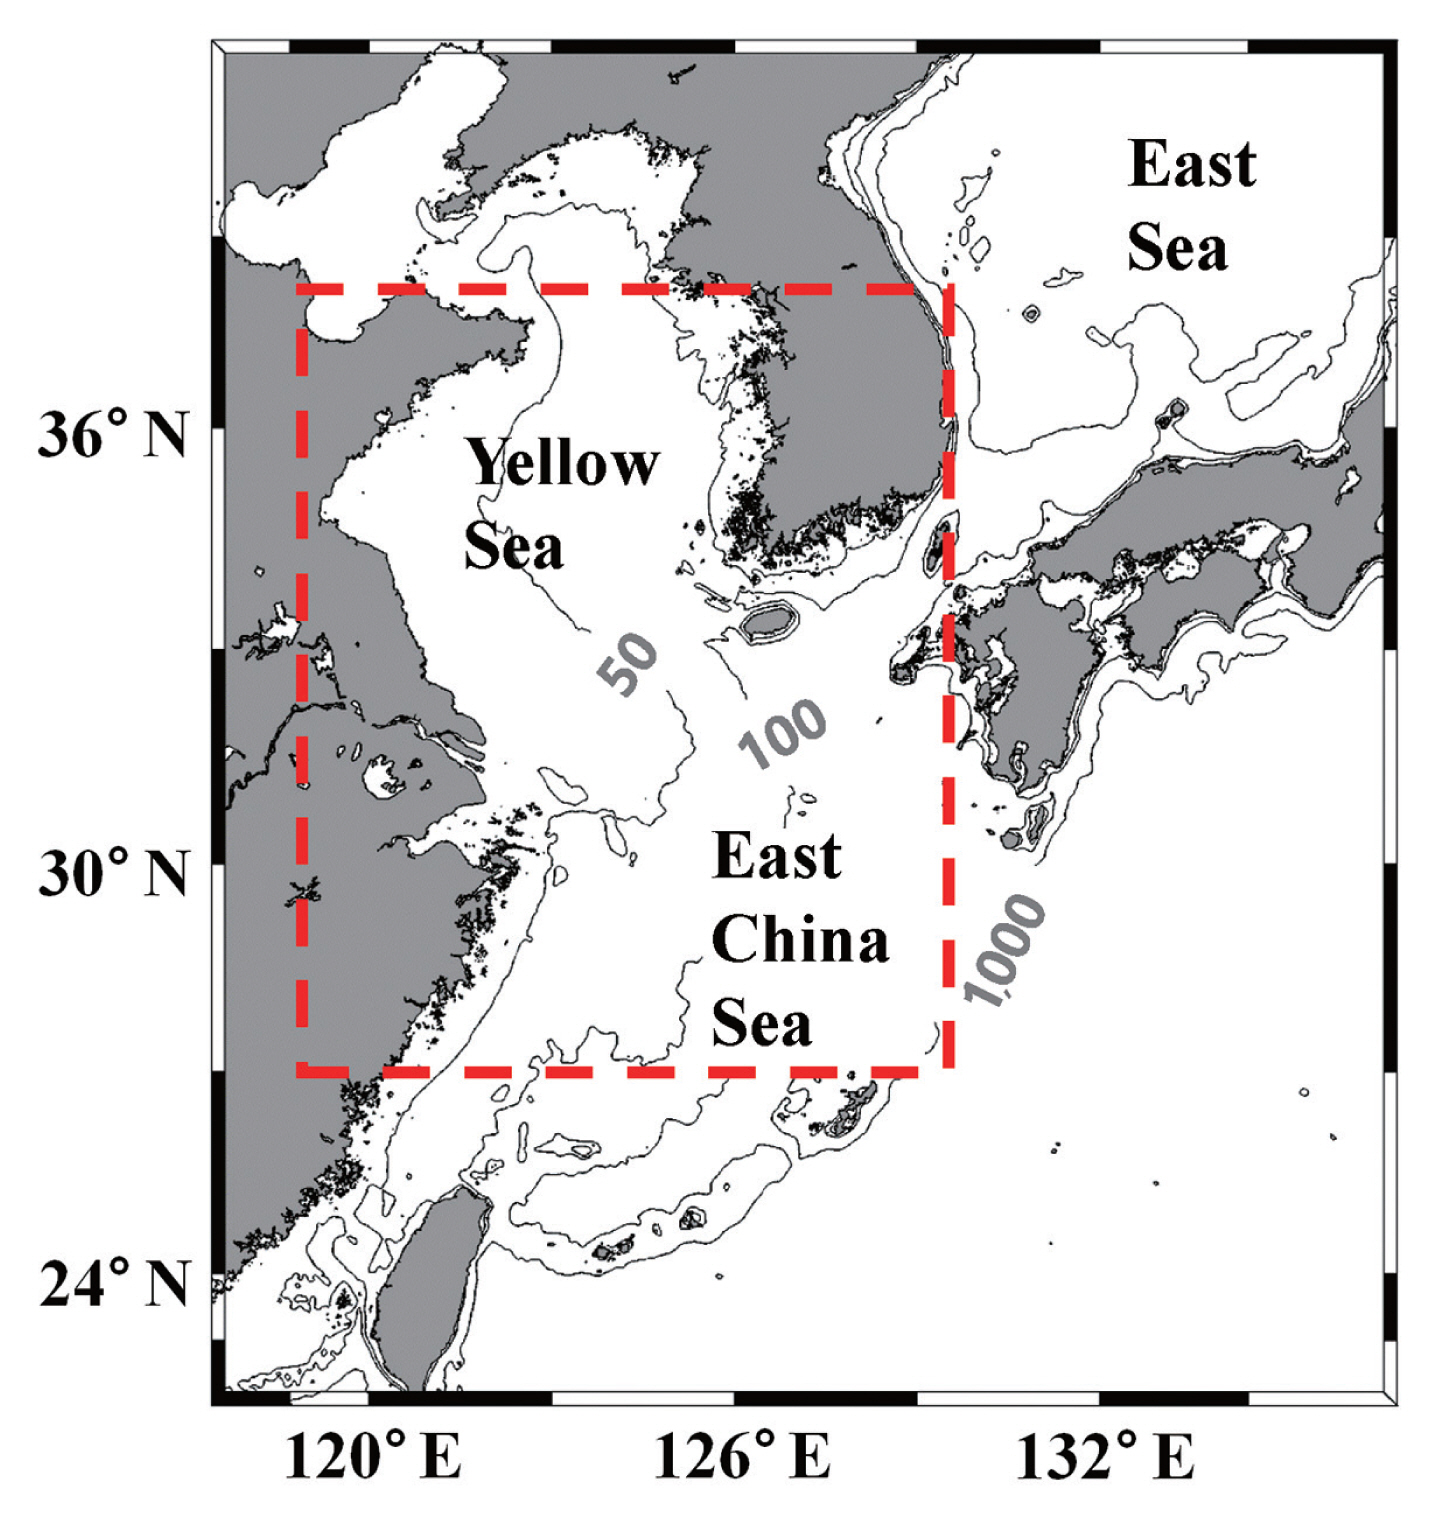
The regional ocean circulation model domain (22.0–41.0° N, 117.4–136.9° E) includes the ECS, YS, East Sea, and northwestern Pacific (Fig. 1). The horizontal grid spacing is approximately 3 km with 41 vertical levels. The bottom topography data were interpolated from a 30-s gridded bathymetric dataset and ETOPO5 from the National Geophysical Data Center (NGDC, http://www.ngdc.noaa.gov/mgg/global/etopo5.HTML). The ocean lateral boundary data were supplied from the global Hybrid Coordinate Ocean Model (HYCOM) (Chassignet et al. 2003). The regional model was initialized with current, temperature and salinity data obtained from the global HYCOM on January 1, 2017. The regional model included the freshwater discharge from 14 rivers along the coast. The riverine freshwater enters the ocean with zero salinity in the model. Daily measured discharge data in 2017 were used for the Changjiang, Yellow, Han, and Keum rivers, and monthly mean climatology data were used for the other rivers in the model. Tidal waves were propagated across the open boundary to the model domain using the eight major tidal components from the TPXO7 dataset (Egbert and Erofeeva 2002), providing the tidal mixing effect. The tides are important for mixing, SST, and heat transfer from the ocean to the atmosphere in the ECS and YS. Atmospheric forcing was based on data from ERA5, the global atmospheric model provided by the European Centre for Medium-Range Weather Forecasts (ECMWF). These forcings included 3-hourly mean air pressure, surface temperature, surface solar radiation, relative humidity, and wind.
Observation data were assimilated using the Ensemble Kalman filter (EnKF) every day from January to December 2017. The EnKF is a sequential data assimilation method (Evensen 1994, Kwon et al. 2016), and this study used 30 ensemble members. Localization was used with a horizontal length scale of 50 km and a vertical de-correlation length scale of 50 m (Kwon et al. 2018). The observation data assimilated into the modeling system were the OSTIA SST, and temperature and salinity profiles from the National Institute of Fisheries Science (NIFS), Korea Hydrographic and Oceanographic Agency (KHOA), Korea Marine Environment Management Corporation (KOEM), and Global Temperature-Salinity Profile Program (GTSPP).
Lagrangian transport model
The Lagrangian TRANSport model (LTRANS) is a particle tracking model that runs with a three-dimensional hydrodynamic model, specifically the ROMS. It uses the 4th order Runge-Kutta scheme for particle advection and a random displacement model for vertical turbulent particle motion (North et al. 2006, 2008). In this study, the time step for the hydrodynamic model and the time interval for particle movement are 24 h and 10 min, respectively. The 4th order Runge-Kutta scheme provides the most robust estimate of the trajectory of particle motion in water bodies with complex fronts and eddy fields (Dippner 2005). Because horizontal diffusivity was constant in the hydrodynamic model (1 m2 s−1), a random walk model was used to simulate turbulent particle motion or subgrid scale processes in the horizontal direction.
If particles, such as floating Sargassum, are directly exposed to surface winds, they are dispersed not only by the ocean currents, but also by the surface winds. In Lagrangian particle tracking simulations, particles drift is affected by both surface currents and direct frictional effect of winds. The Lagrangian particle tracking simulations were conducted with windage effect using the LTRANS model and windage means drag by the momentum transfer from winds to a floating object in the downwind direction. All particles were assumed to move within the surface layer without growth, death, sinking, or vertical movement in this study. Trajectory of the particles can be tracked forward or backward in time in the Lagrangian particle tracking simulation. The forward (backward) tracking mode was used to determine the destination (source region) of floating particles.
Validation of the particle tracking model
For a given synthetic (or virtual) particle (i) located at {xs(i), ys(i)} in the model domain, the matched macroalgae patch (j), the closest to the synthetic particle (i), at {xo(j), yo(j)} was sought on the satellite image. The distance (Dk) between the synthetic particle and the matched macroalgae patch was calculated for every synthetic particle:
, where k is an index for a matching pair of a synthetic particle (i) and its corresponding macroalgae patch (j). If the distance was greater than 40 km, the synthetic particle was considered to be a particle without matching macroalgae patch. The mean distance (MD) between the synthetic particles and the matched macroalgae patches at time t is a measure of how good the Lagrangian particle tracking is:
, where N is the number of matched macroalgae patches in a single satellite image at time t.
RESULTS
Satellite observation of Sargassum patches
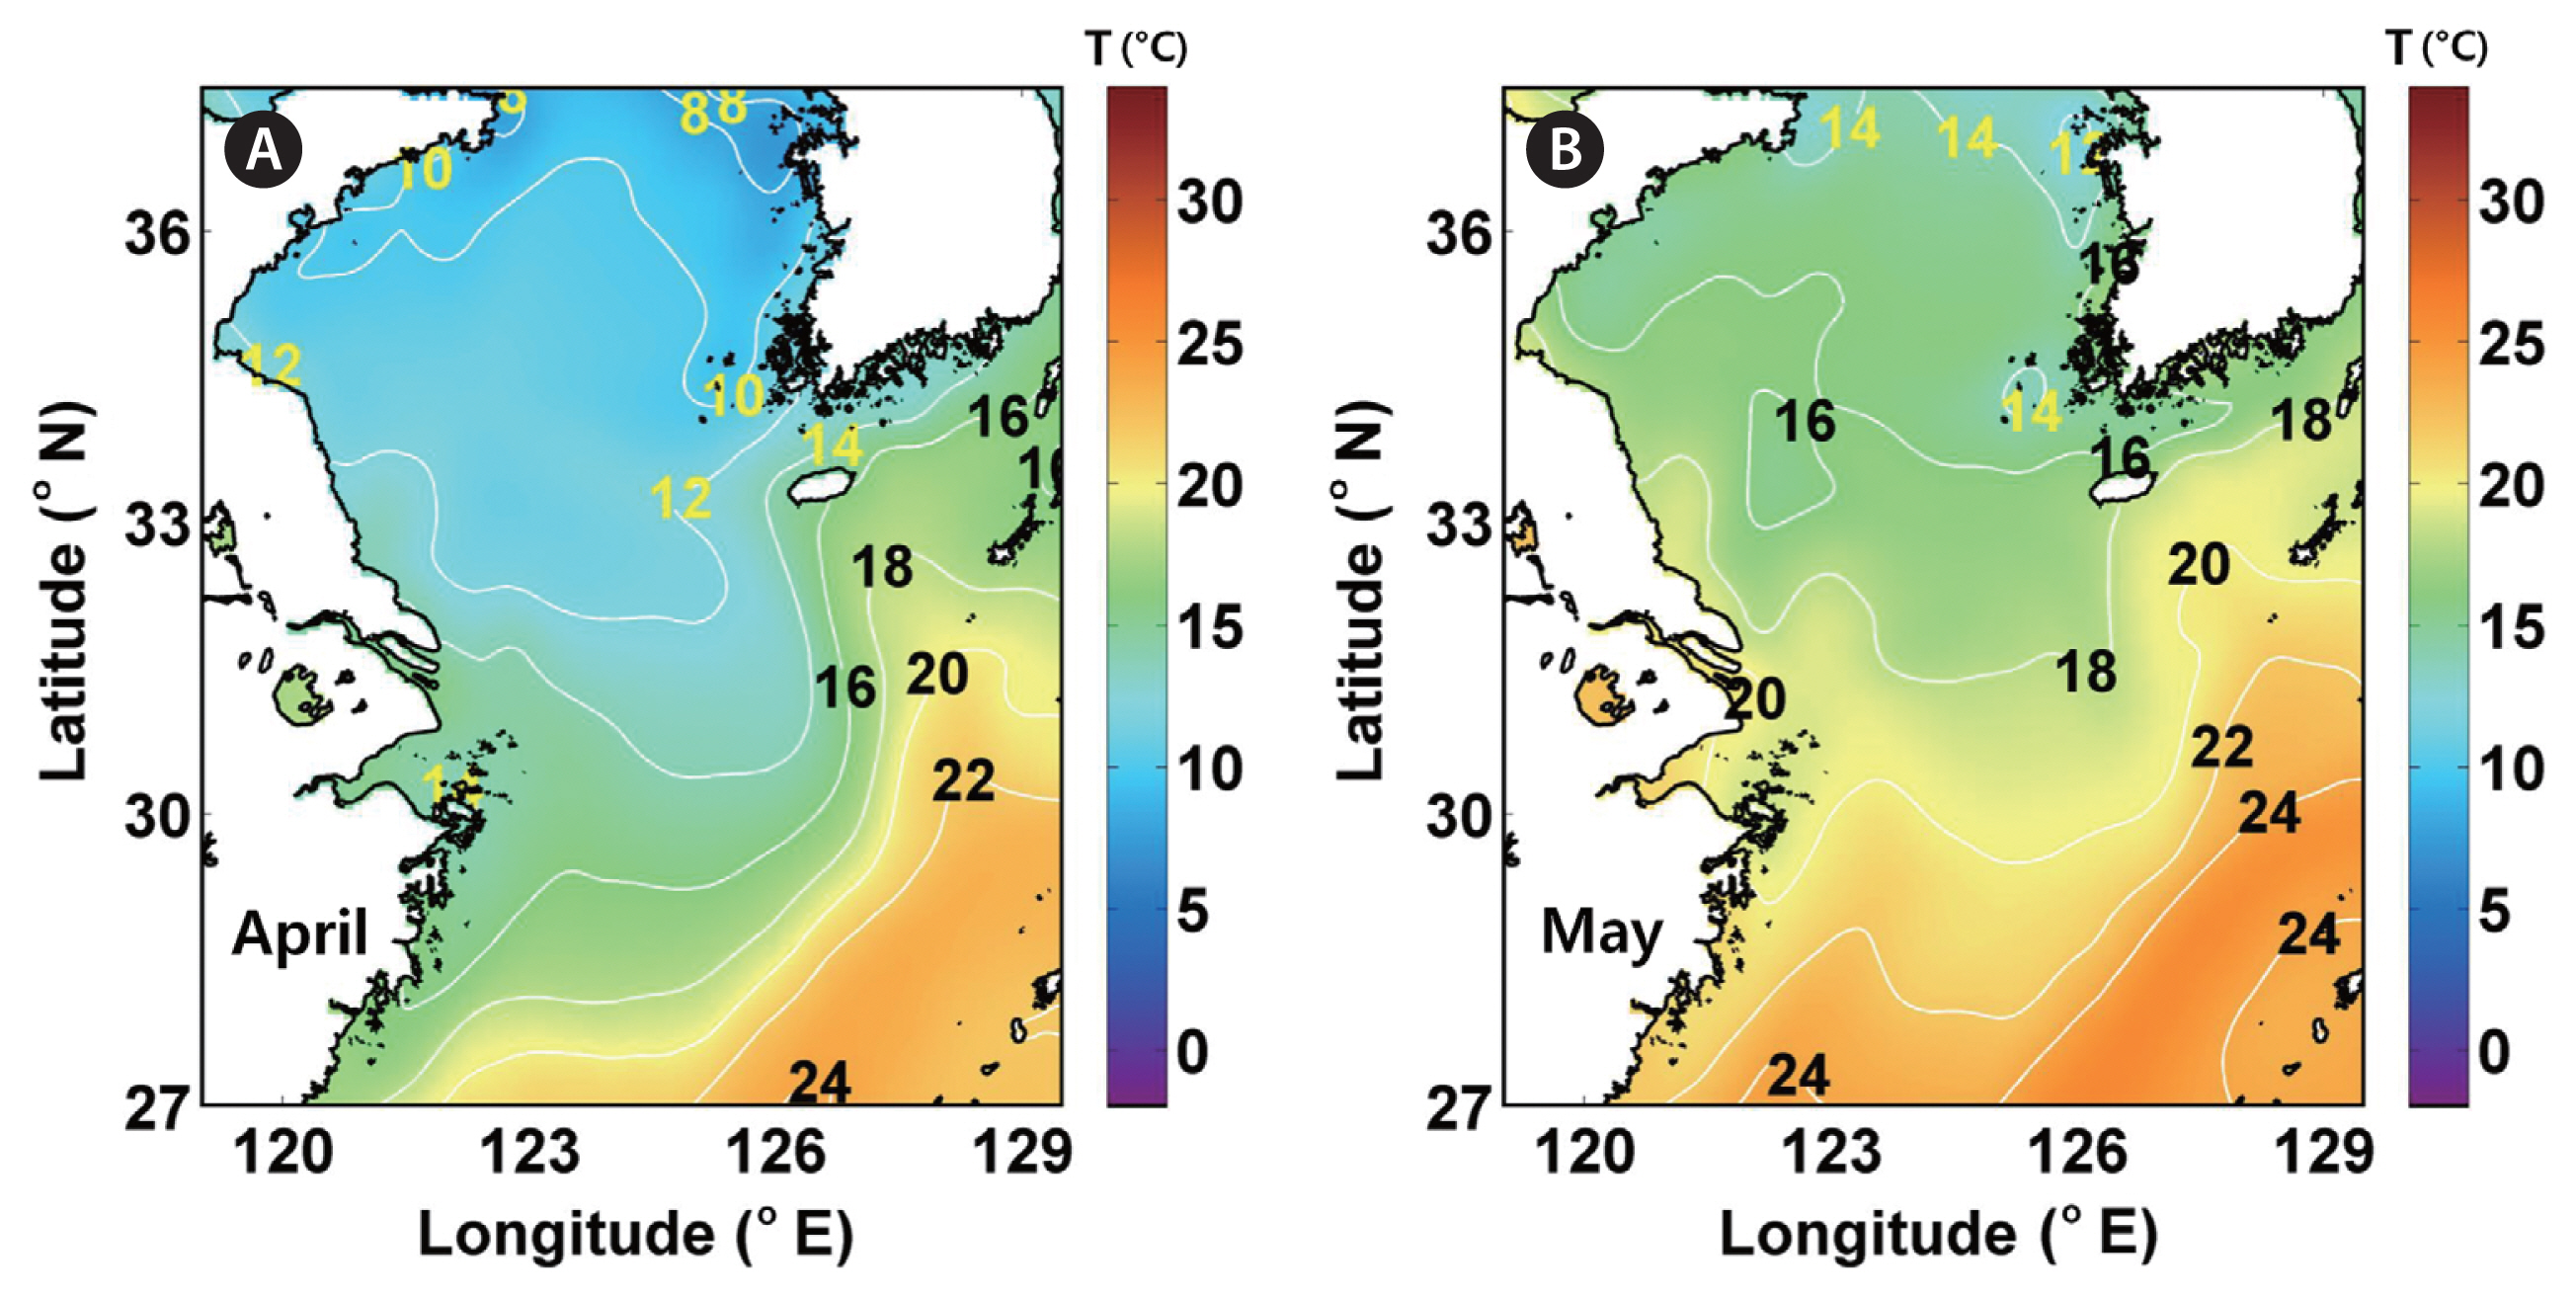
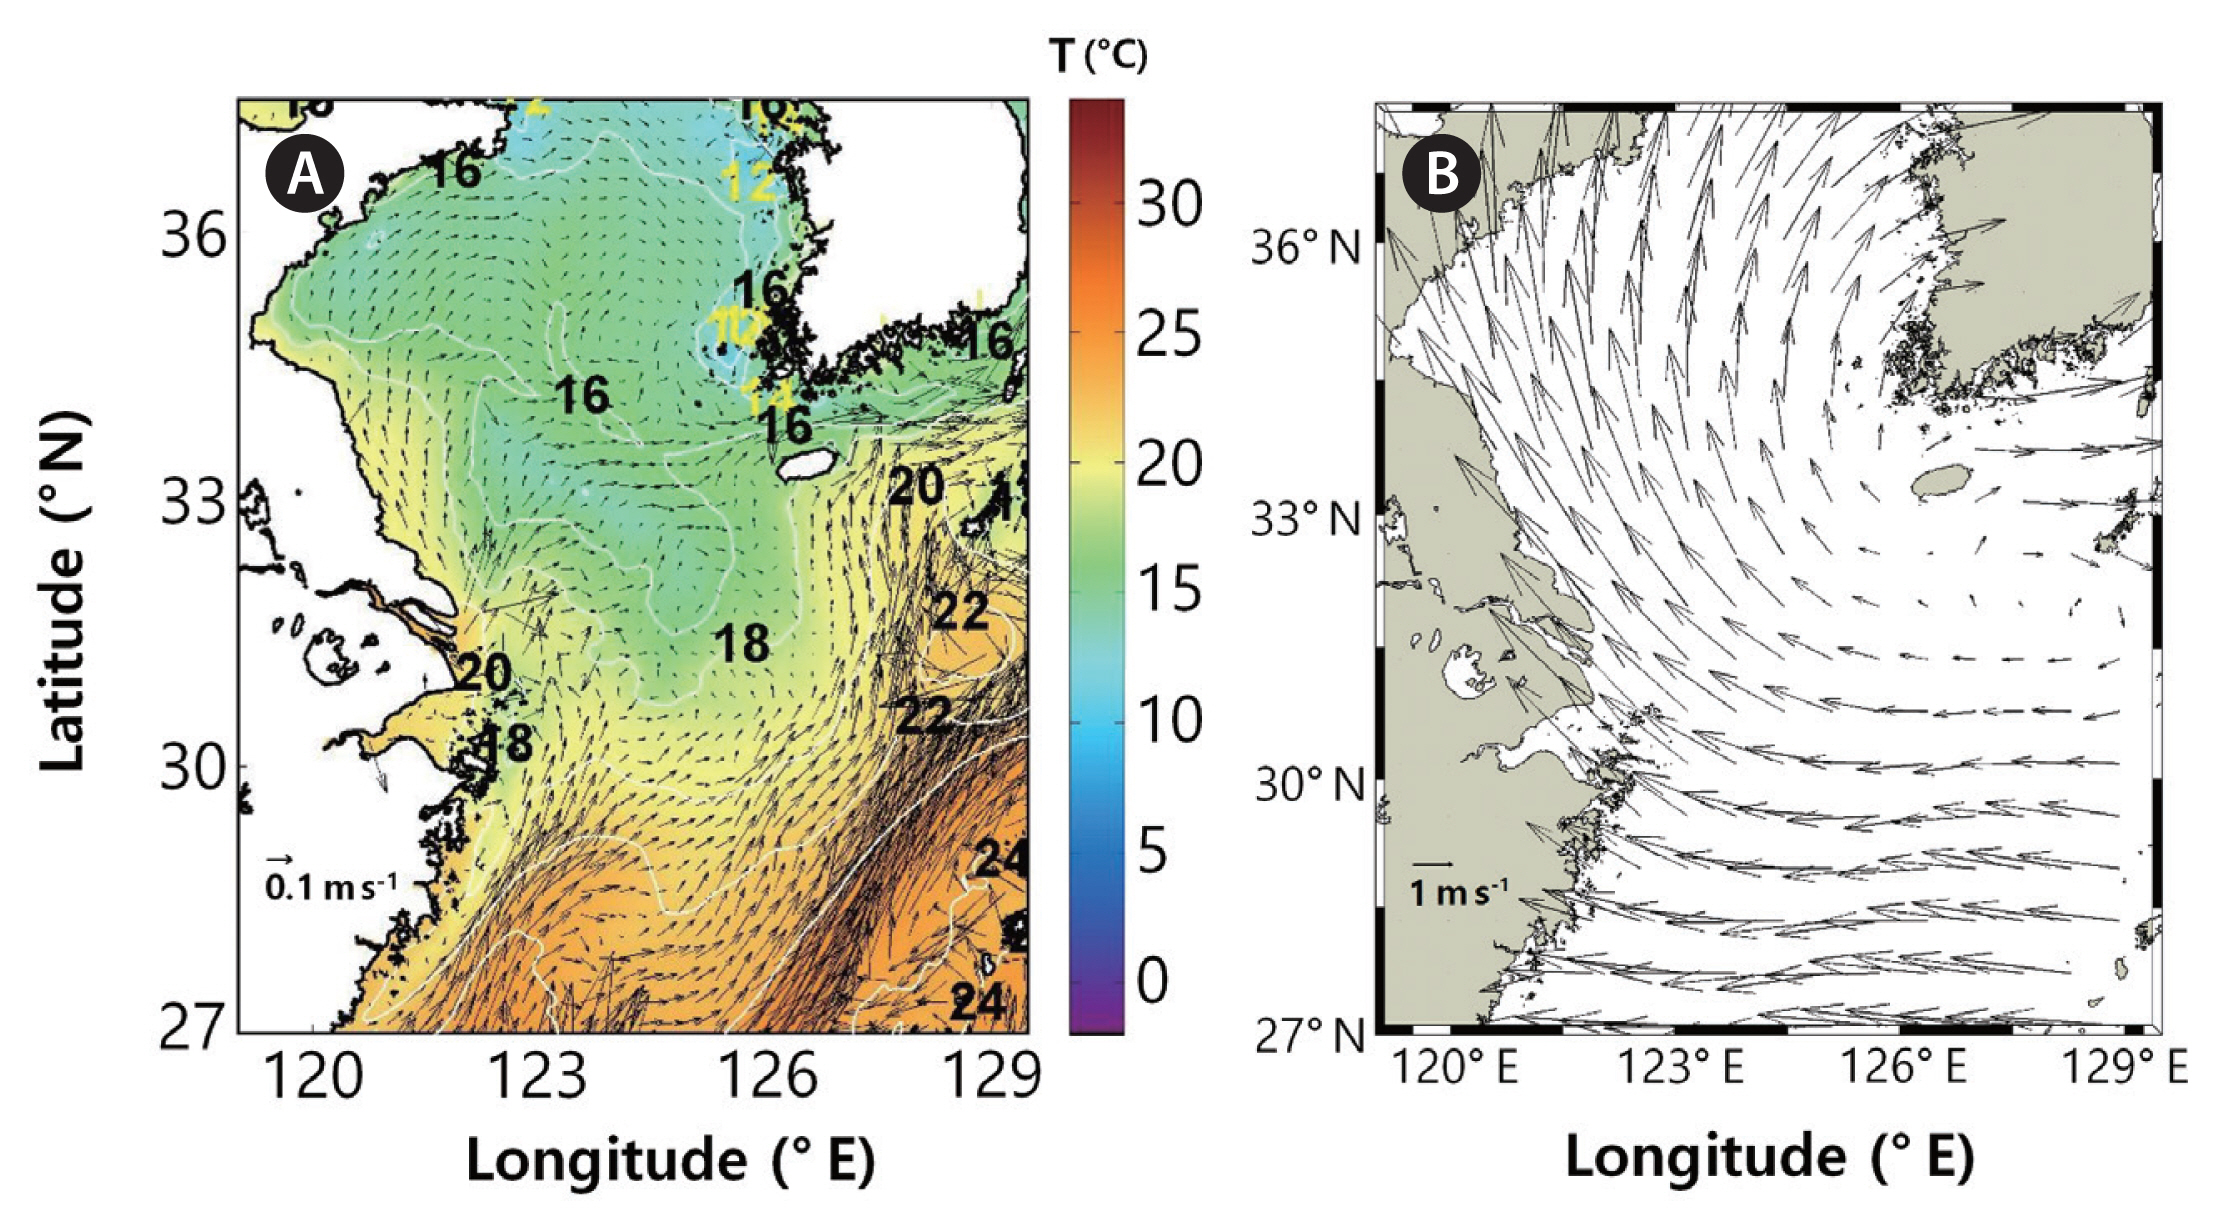
SST ranged from 10 to 22°C in the ECS and YS in April 2017, and increased to 14–24°C in May 2017 (Fig. 2). SST along the Kuroshio ranged from 22 to 24°C in April and May. When the horizontal distribution of SST in the model was compared with that of the OSTIA SST, the root mean square errors were 0.73 and 0.74°C for April and May 2017, respectively. Warm surface water flowing northeastward along the Chinese coast reached the mouth of the Changjiang (Yangtze River) and then headed southeast because relatively cool water (<18°C) occupied the northern ECS. A branch of warm and saline water flowed from the Kuroshio main stream toward the Korea Strait along 127–128° E and passed through the Korea Strait.
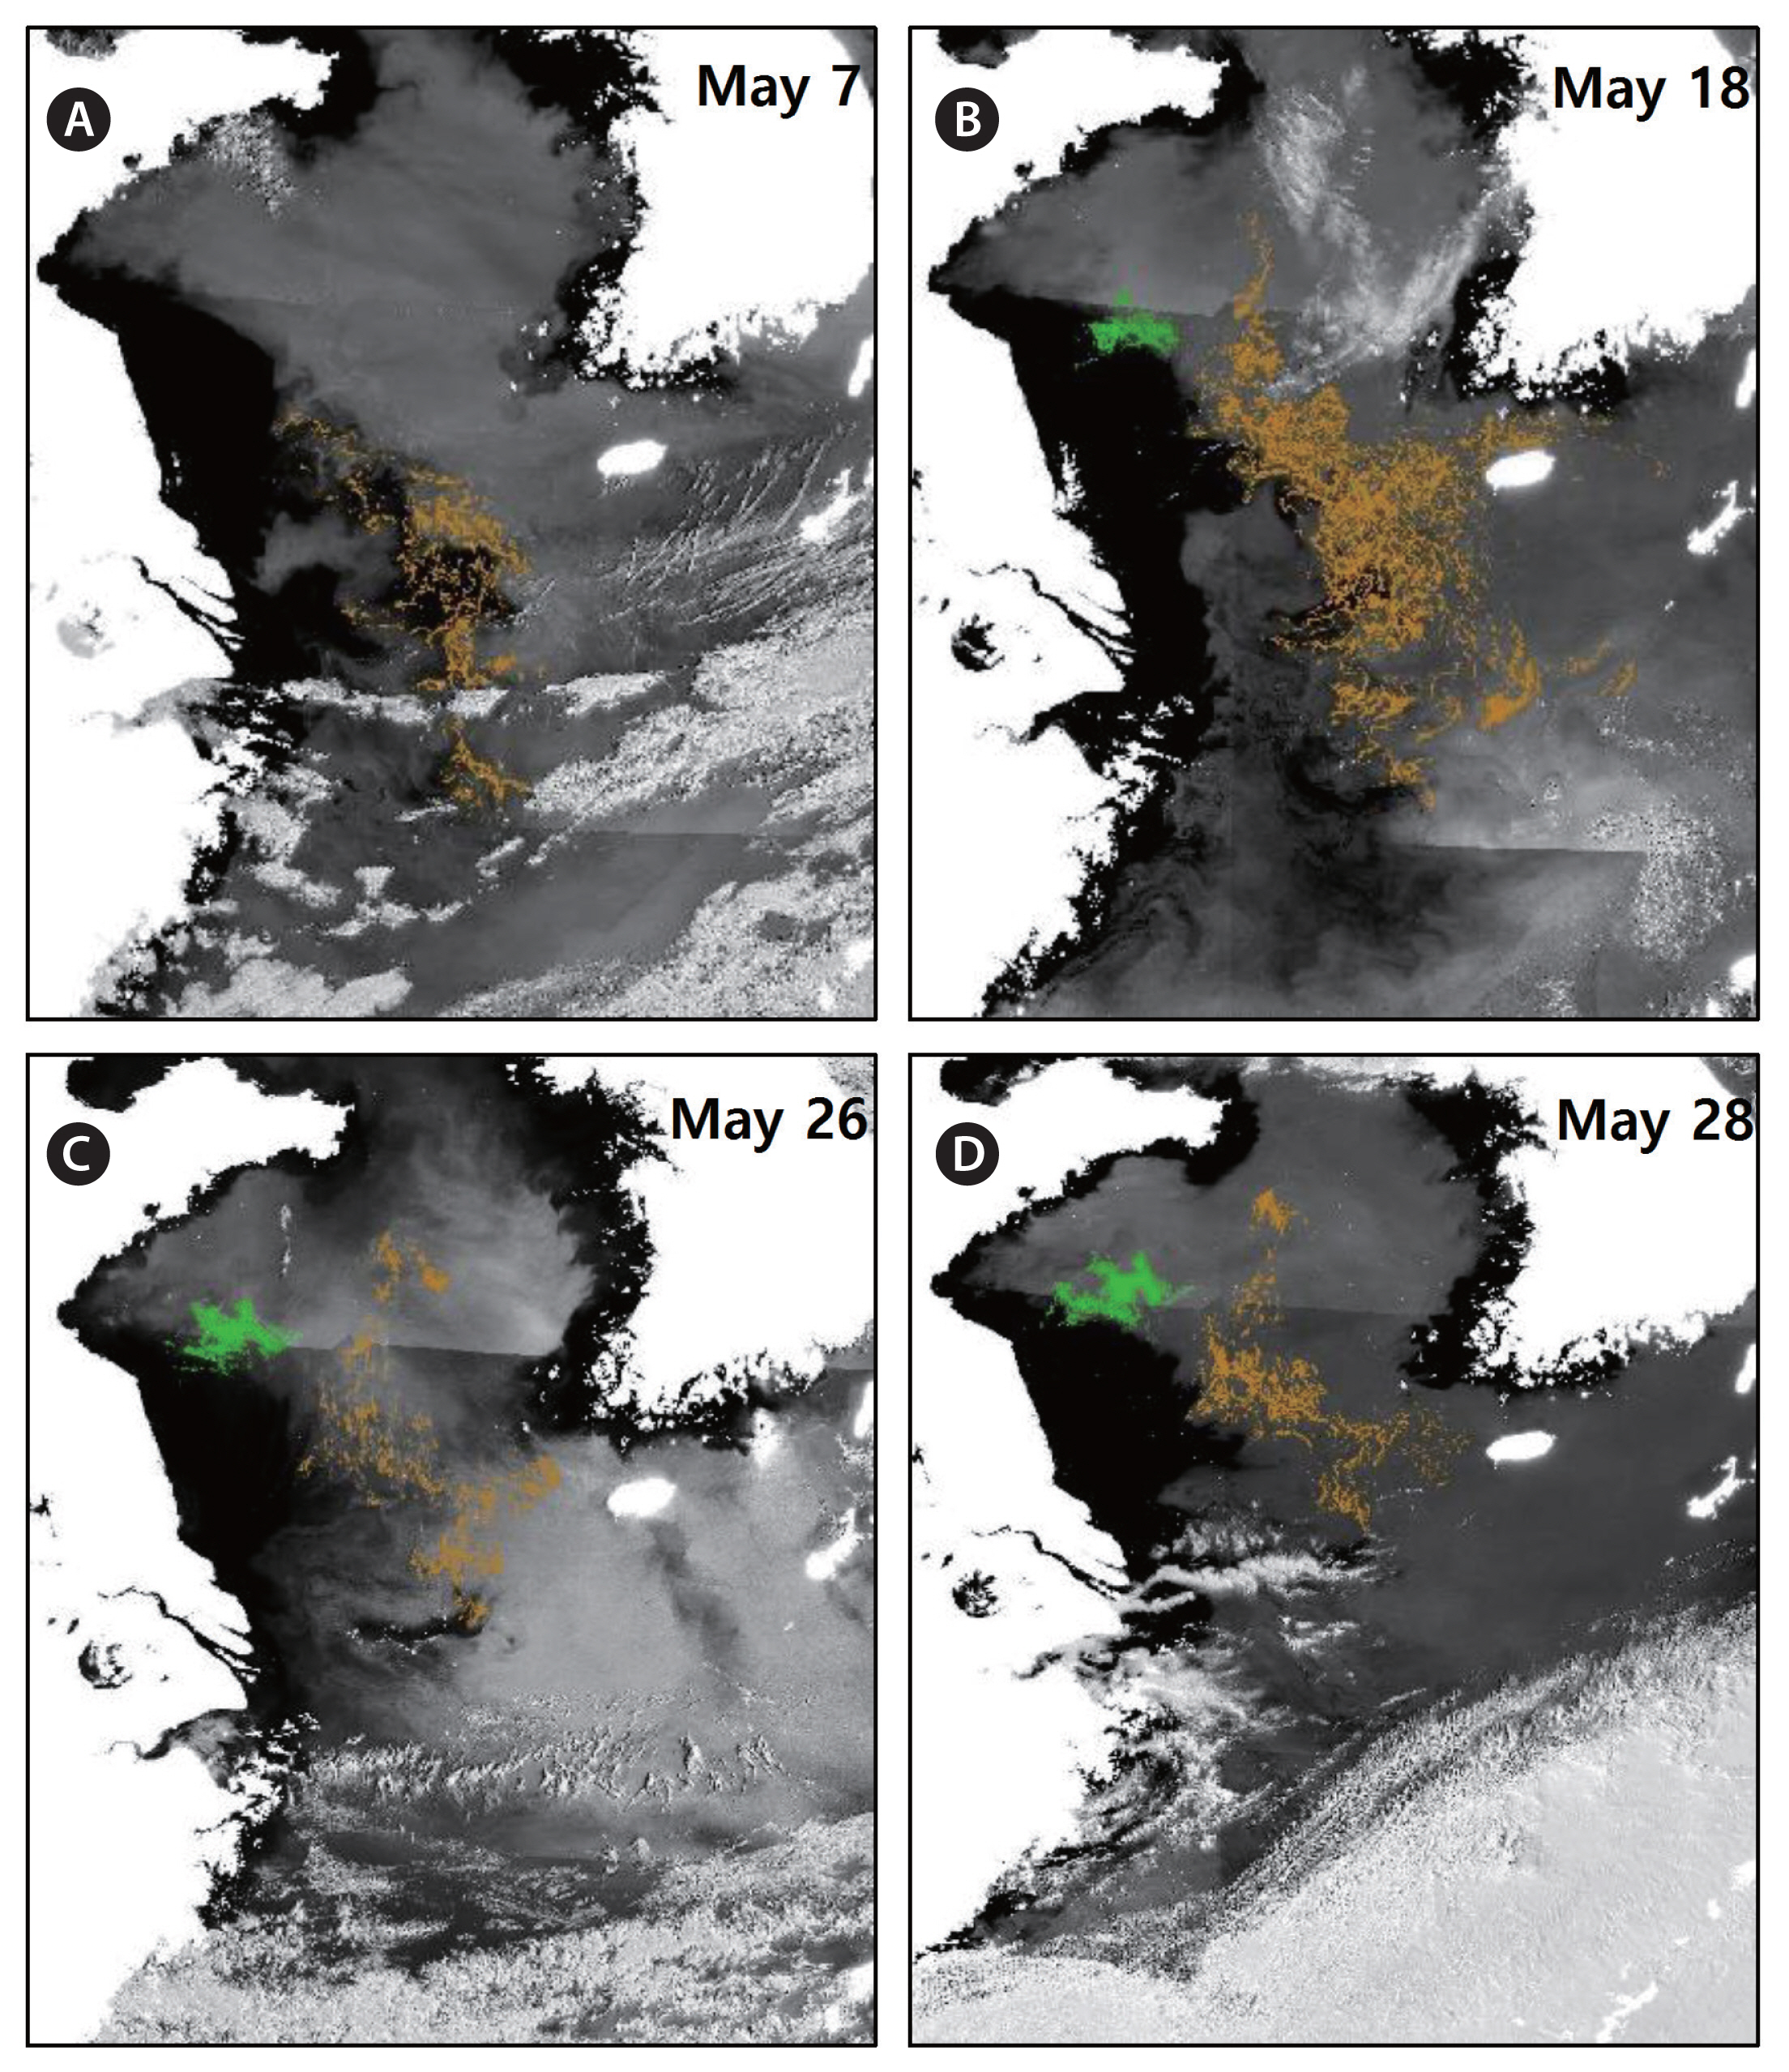
The GOCI detected brown and green macroalgae in the ECS and YS in May 2017 (Fig. 3). In Fig. 3, brown patches represent Sargassum horneri in the ECS and YS, and green patches represent Ulva prolifera (Kim et al. 2019, Xing et al. 2019). The background image is a true color composite on the same day. Large brown macroalgae patches were observed in the northern ECS on May 7 (Fig. 3A), and they moved northeastward entering the YS on May 18 (Fig. 3B). The brown macroalgae patches moved north from May 18 to May 26 (Fig. 3C) and, were then carried farther north on May 28 (Fig. 3D). The coverage of macroalgae patches was the largest in the satellite image captured on May 18, 2017. If the number of macroalgae patches in the ECS and YS does not change in 11 days, there may have been some missing macroalgae patches in the GOCI image on May 7, 26, and 28, 2017 because of cloud cover or sea fog.
Lagrangian particle tracking experiments
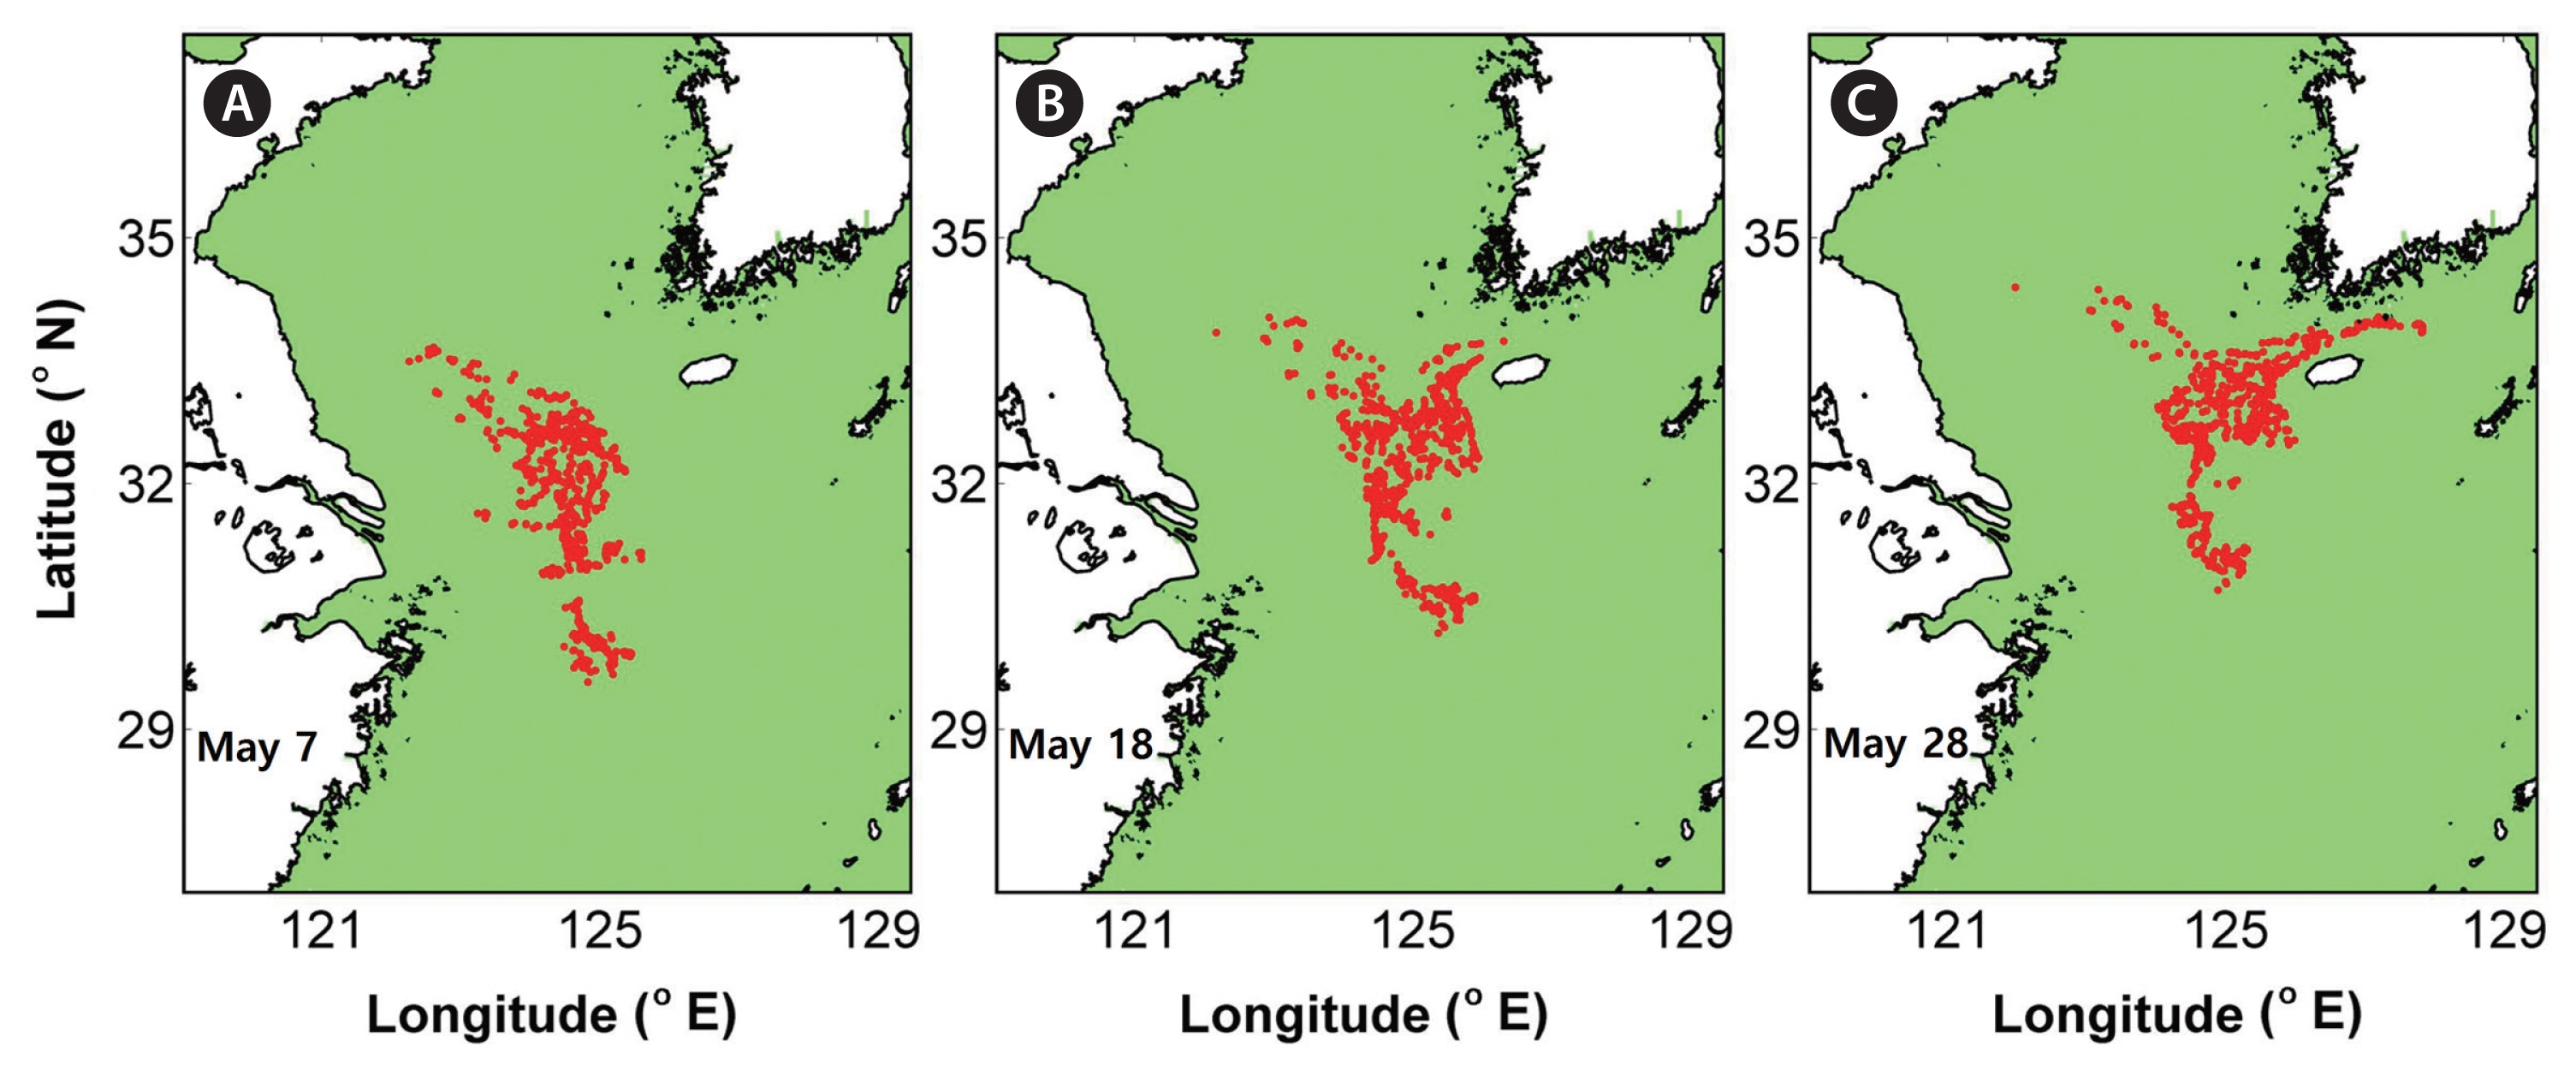
To trace macroalgae patches in May 2017, Lagrangian particle tracking experiments were conducted. Although the number of macroalgae patches was 11,228 in the satellite image on May 7, 2017 (Fig. 3A), synthetic particles released in the Lagrangian particle tracking experiment were evenly subsampled from the observation data and the number of released synthetic floating particles was 749. The synthetic floating particles were released on May 7, 2017 and the particles were advected by both surface currents and winds (Fig. 4). The synthetic Lagrangian particles moved toward the Jeju Strait on May 18 and were floating southwest of the Jeju Strait on May 28, 2017.
When the spatial distribution of the synthetic particles was compared with the observed distribution on the satellite image on May 18, 2017 (Fig. 3B), there was large number of macroalgae patches in the YS in the satellite image, but there was a limited number of synthetic particles in the YS after the Lagrangian particle simulation (Fig. 4B). This finding implies that some brown macroalgae patches in the YS were not observed by the GOCI on May 7, 2017, and the forward particle tracking simulation was initialized without some macroalgae patches in the north and southeast, which resulted in smaller coverage of particles on May 18 and 28, 2017 (Fig. 4B & C).
Sensitivity to the windage factor
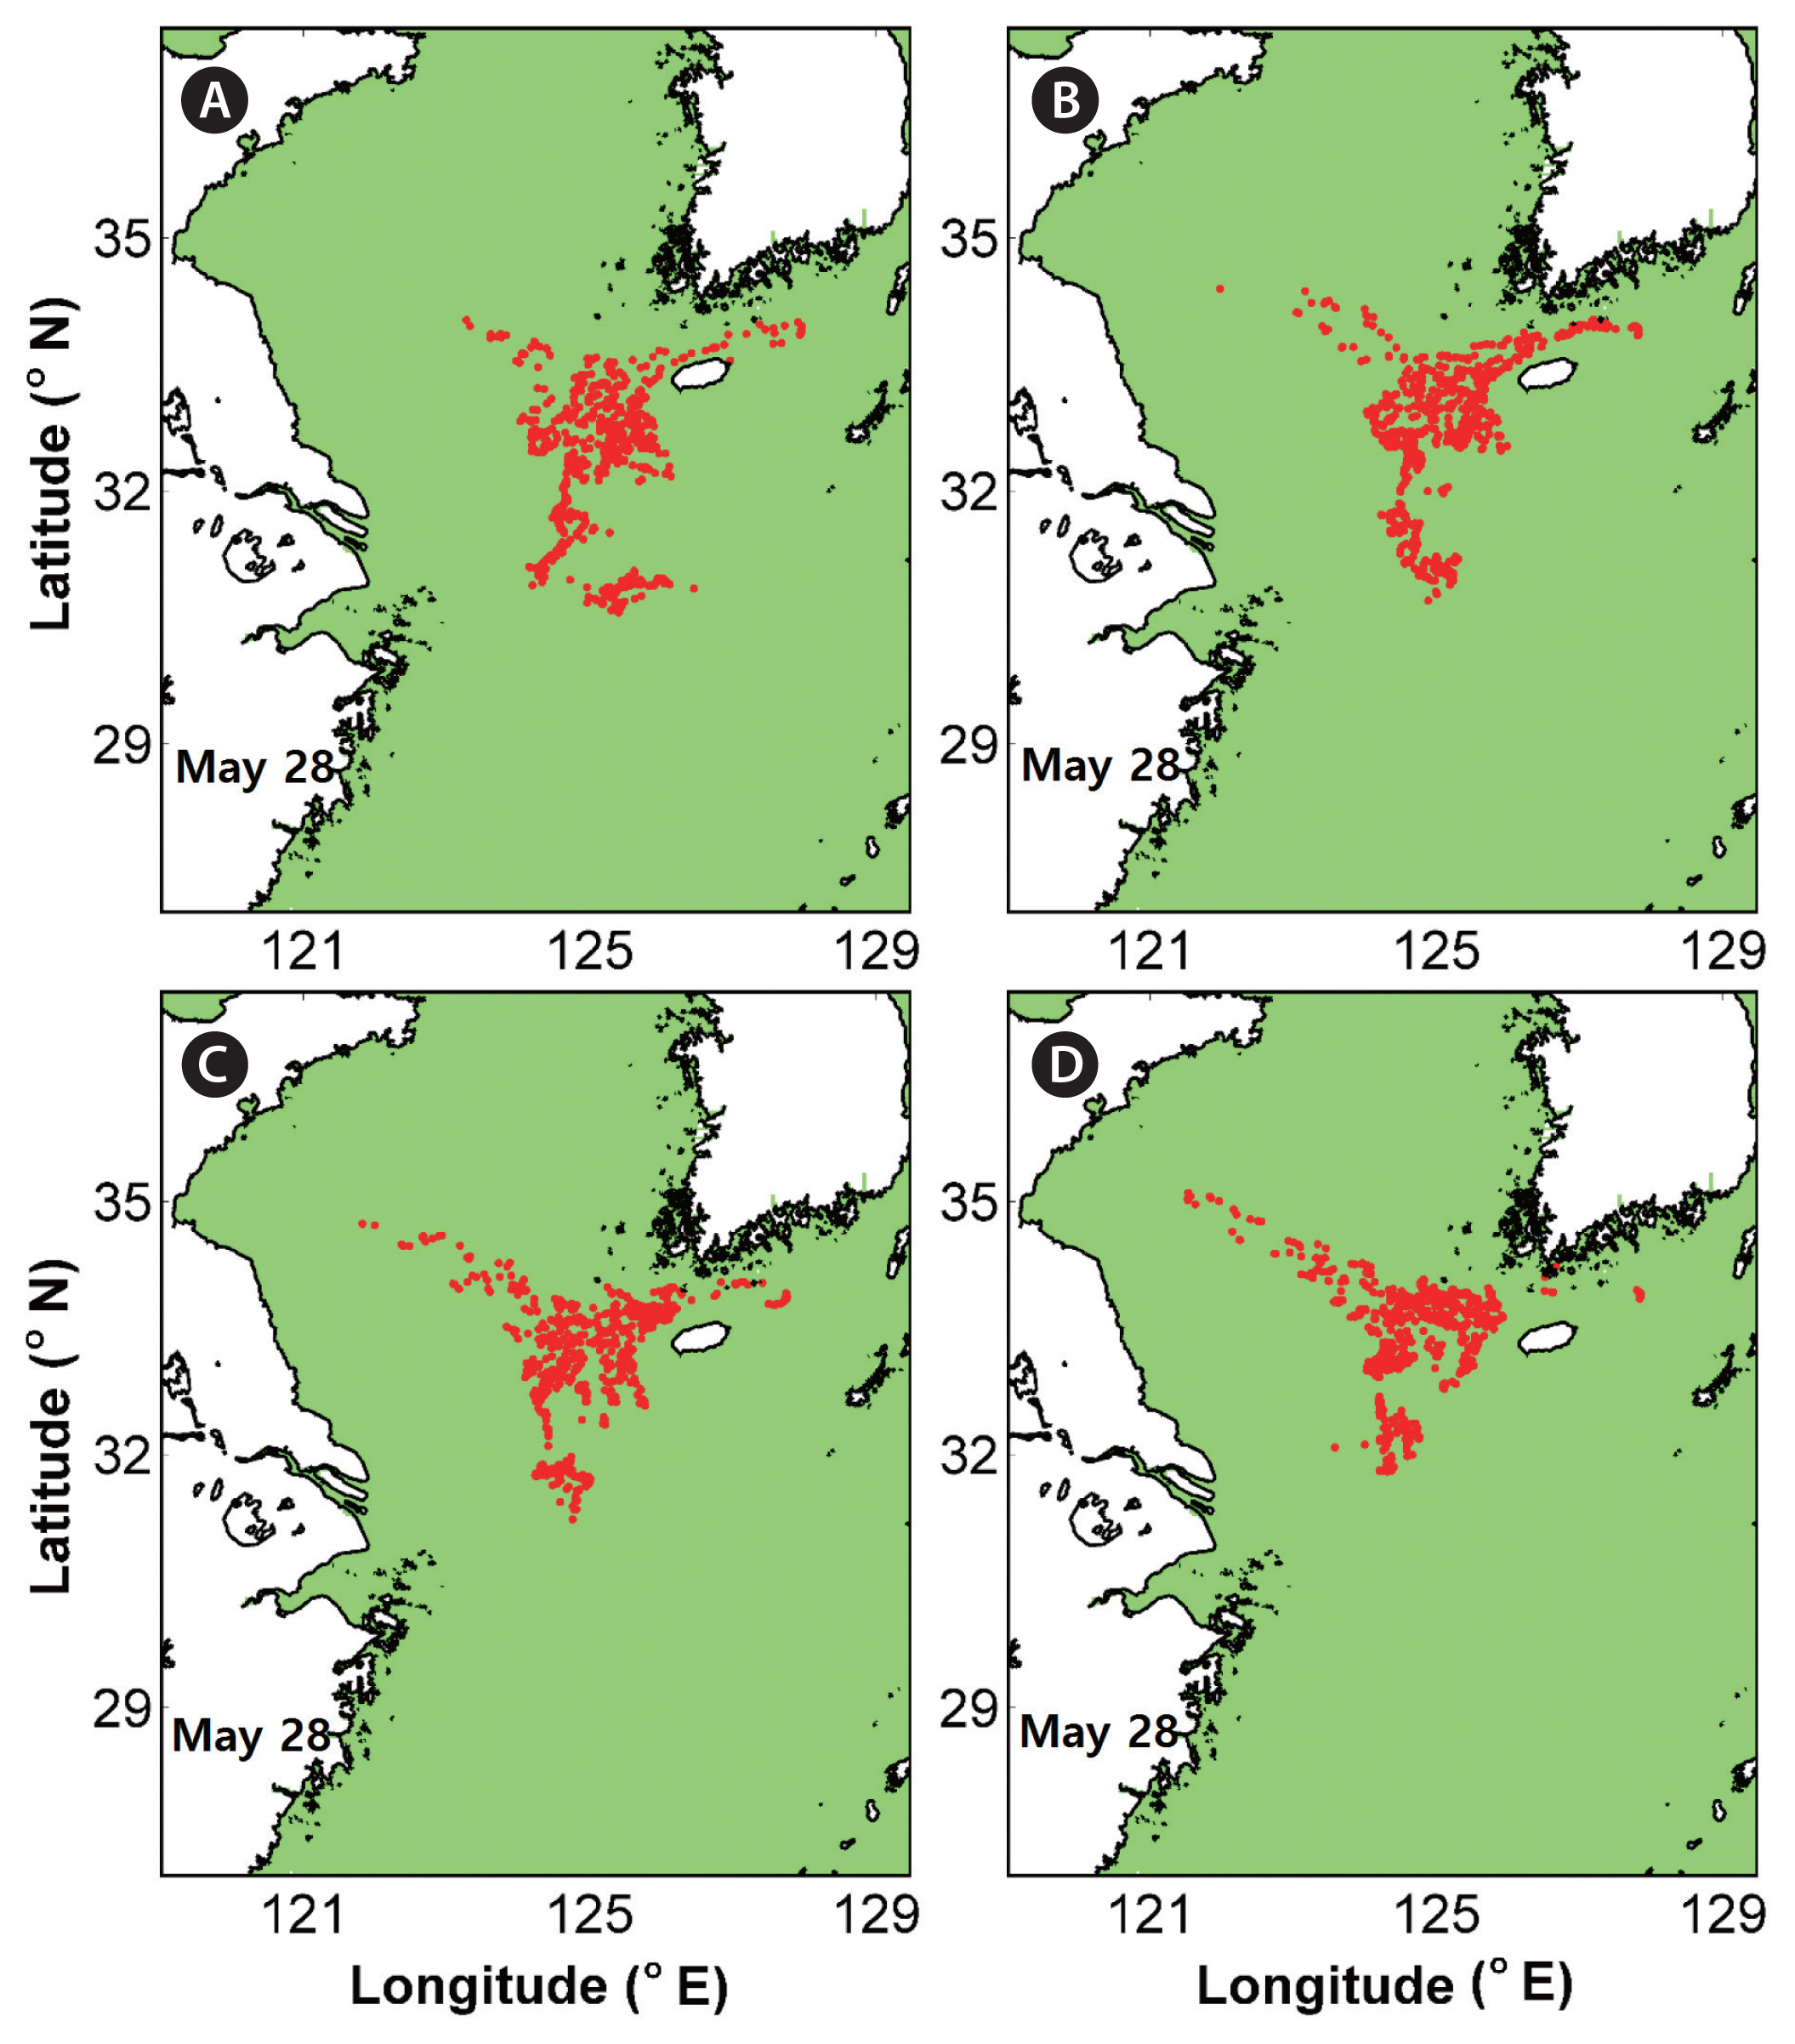
Forward particle tracking simulations were performed according to the ranges of windage factors proposed in previous studies (Son et al. 2015, Brooks et al. 2018, Putman et al. 2018, Wang et al. 2019) and the synthetic particles were released on May 7, 2017. The spatial distribution of the synthetic particles on May 28 depended on the windage factor; as this factor was increased, the intrusion of particles into the YS increased (Fig. 5). It was difficult to determine which windage factor led to the distribution of synthetic particles that best matched the observed macroalgae patches in the satellite image captured on May 28, 2017.
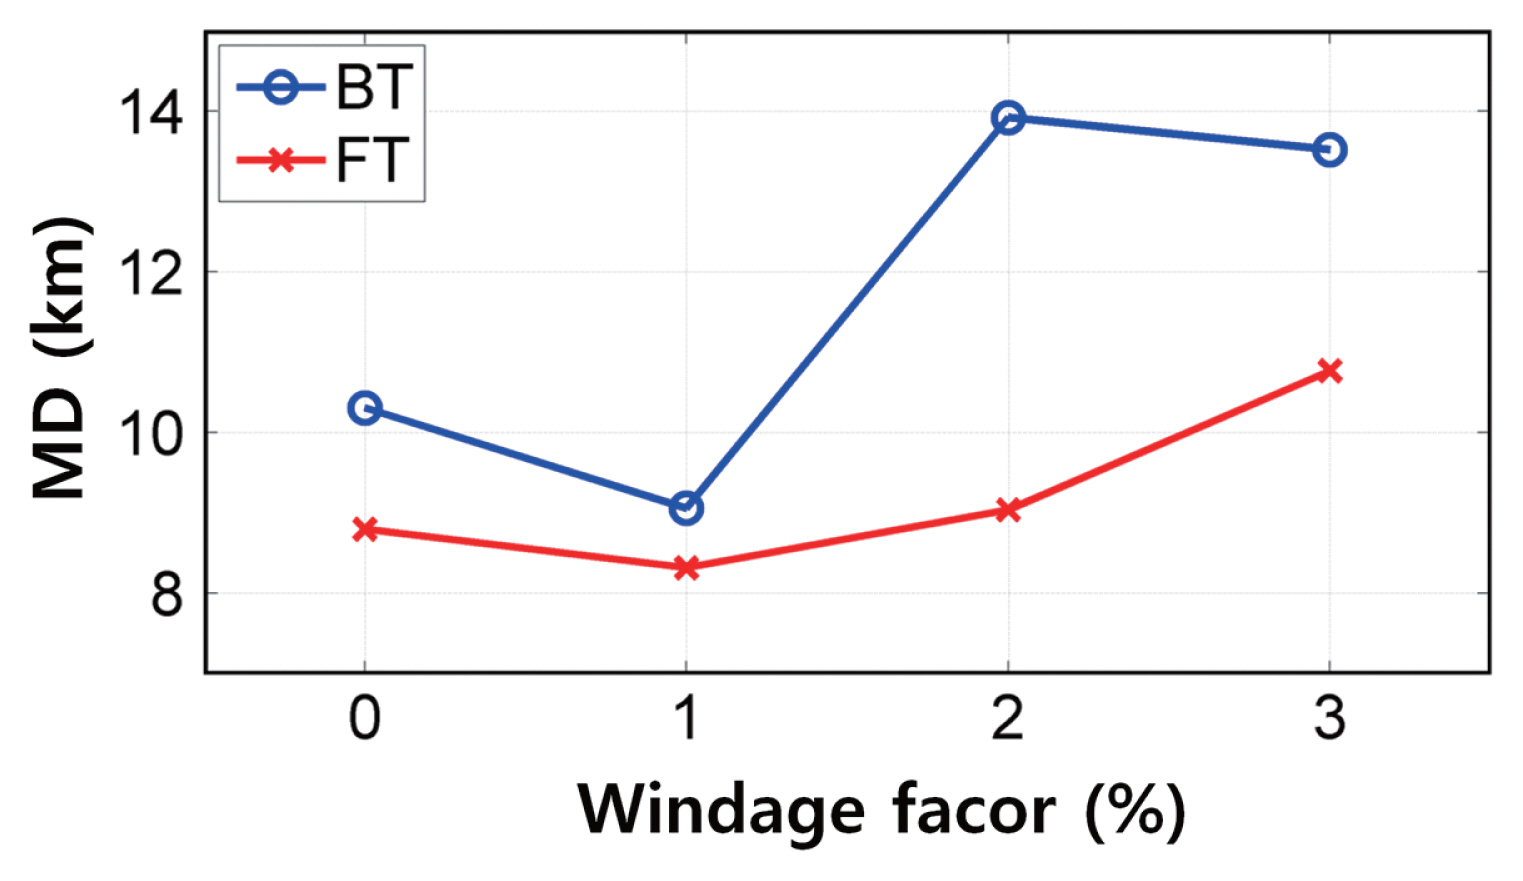
To determine the best windage factor to match the predicted distribution of synthetic particles with the observed distribution of macroalgae patches, forward and backward particle tracking experiments were conducted from May 18, 2017, when the greatest amount of macroalgae was observed in the satellite images (Fig. 3B). The number of macroalgae patches was 42,614 in the GOCI image on May 18; they were evenly subsampled, and the number of synthetic floating particles released was 711. The backward tracking (BT) simulation was conducted from May 18 to May 7, 2017 and the forward tracking simulation was performed from May 18 to May 28, 2017 (Fig. 6). The windage factor of 1% minimized the MD between the synthetic particles and observed macroalgae patches on May 7 and 28, 2017 (Fig. 6).
Forward and backward particle tracking simulations
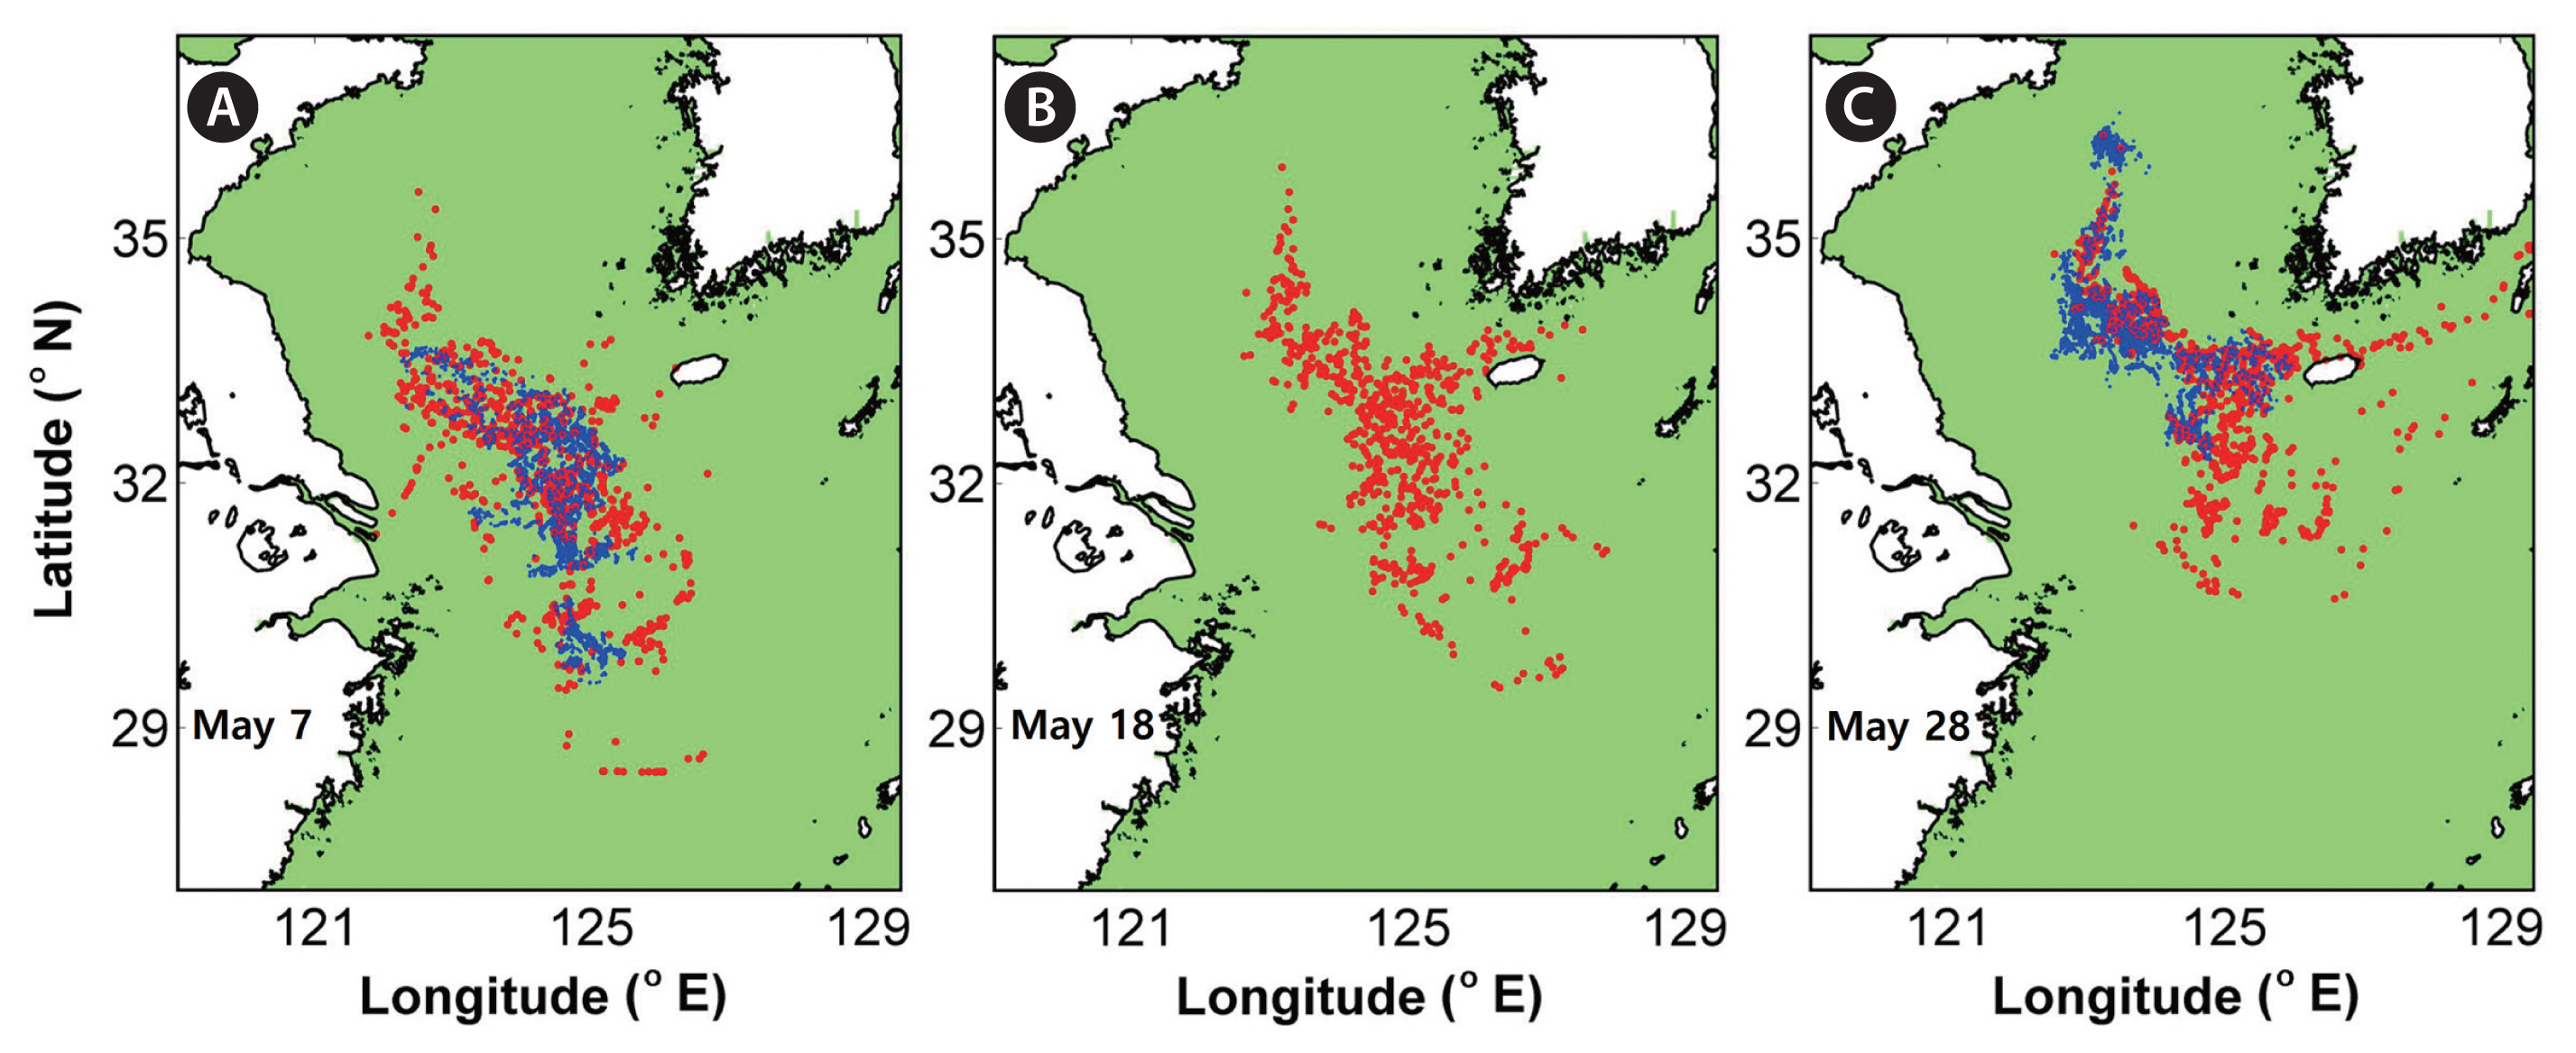
The distribution of synthetic particles (red dots in Fig. 7A), drifted backward in time from May 18 to May 7, overlapped with the horizontal range of the observed macroalgae patches (blue dots). The MD between the synthetic particles and the observed macroalgae patches was 9.1 km (Fig. 6). There are unmatched patches in Fig. 7A because the synthetic particles in Fig. 7B are evenly subsampled particles from the observed patches in Fig. 3B and satellites could not detect all macroalgae patches due to cloud cover and sea fog. Although the synthetic particles north of 34° N were not observed by satellite sensors on May 7, they were recovered by the backward particle tracking simulations. The synthetic particles (blue dots in Fig. 7C), drifted forward in time from May 18 to May 28, covered the horizontal range of the observed macroalgae patches. The MD between the synthetic particles and the observed macroalgae patches was 8.3 km. Forward particle tracking simulations restored many patches in the northeastern ECS and the Korea Strait. The Lagrangian particle tracking model has the potential to restore the missing patches in satellite images caused by cloud contamination.
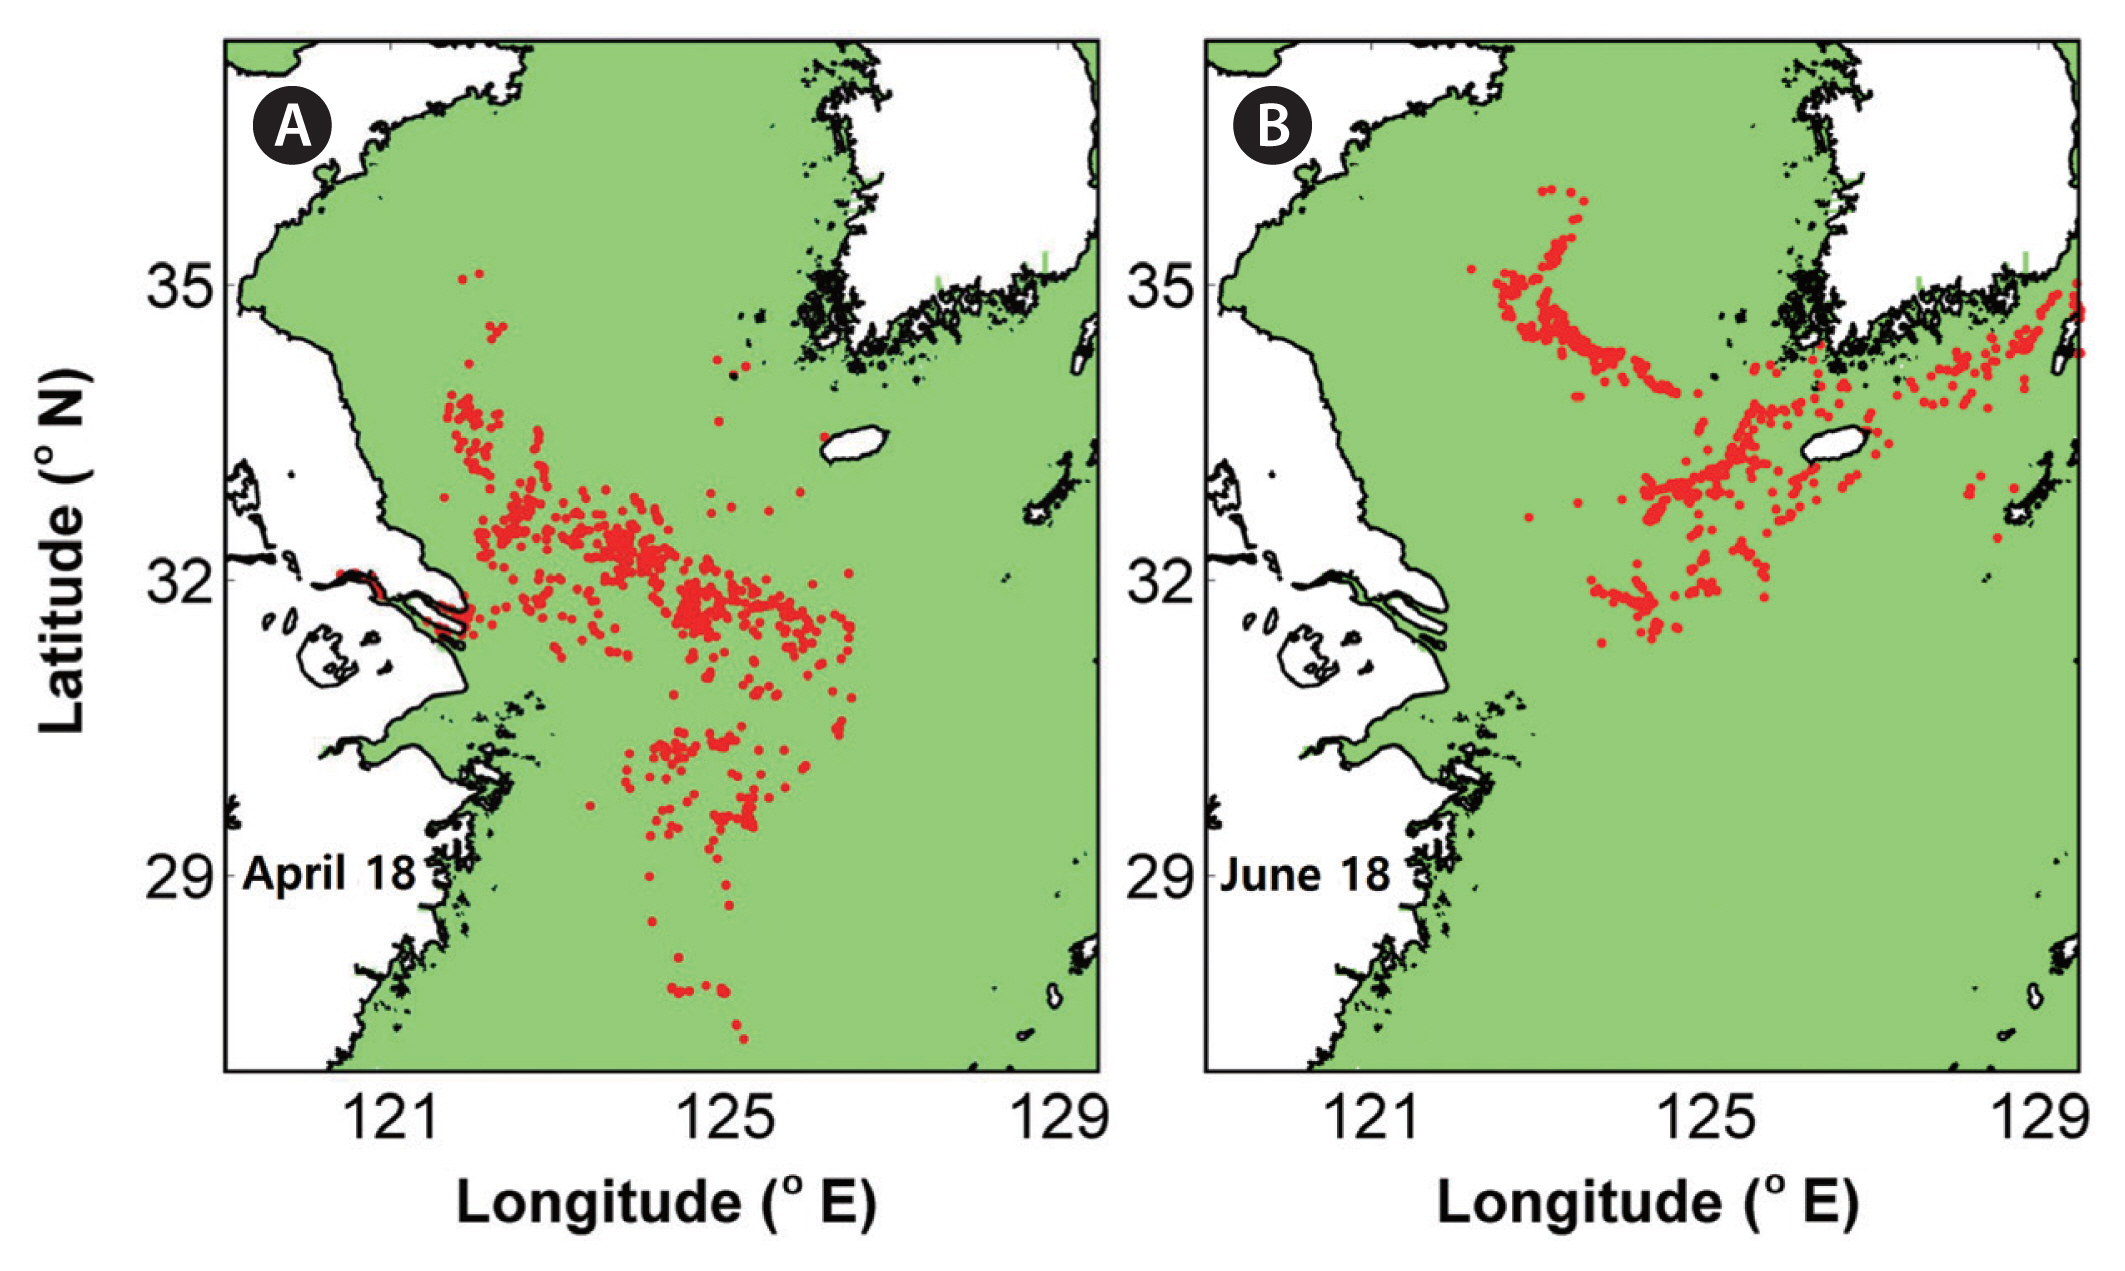
Backward particle tracking was conducted from May 18 to April 18 to determine where the macroalgae patches were located one month before (Fig. 8A). The synthetic particles were translated southwestward without large distortion during the BT. On April 18, the synthetic particles had a wider horizontal range and were farther apart from each other. Forward particle tracking was conducted from May 18 to June 18 to determine where the macroalgae patches were headed one month later (Fig. 8B). The synthetic particles in the YS converged together to form a meridional line and the synthetic particles in the ECS drifted eastward through the Jeju Strait and the Korea Strait. These one-month long particle tracking experiments were carried out on the assumption that Sargassum horneri patches would not sink or increase during the drift. Few satellite ocean color images detected the brown macroalgae in the ECS in April and June 2017 (Zhang et al. 2019) and verification of the one-month long particle tracking simulation results was therefore limited.
Role of winds on northward Sargassum drift into the YS
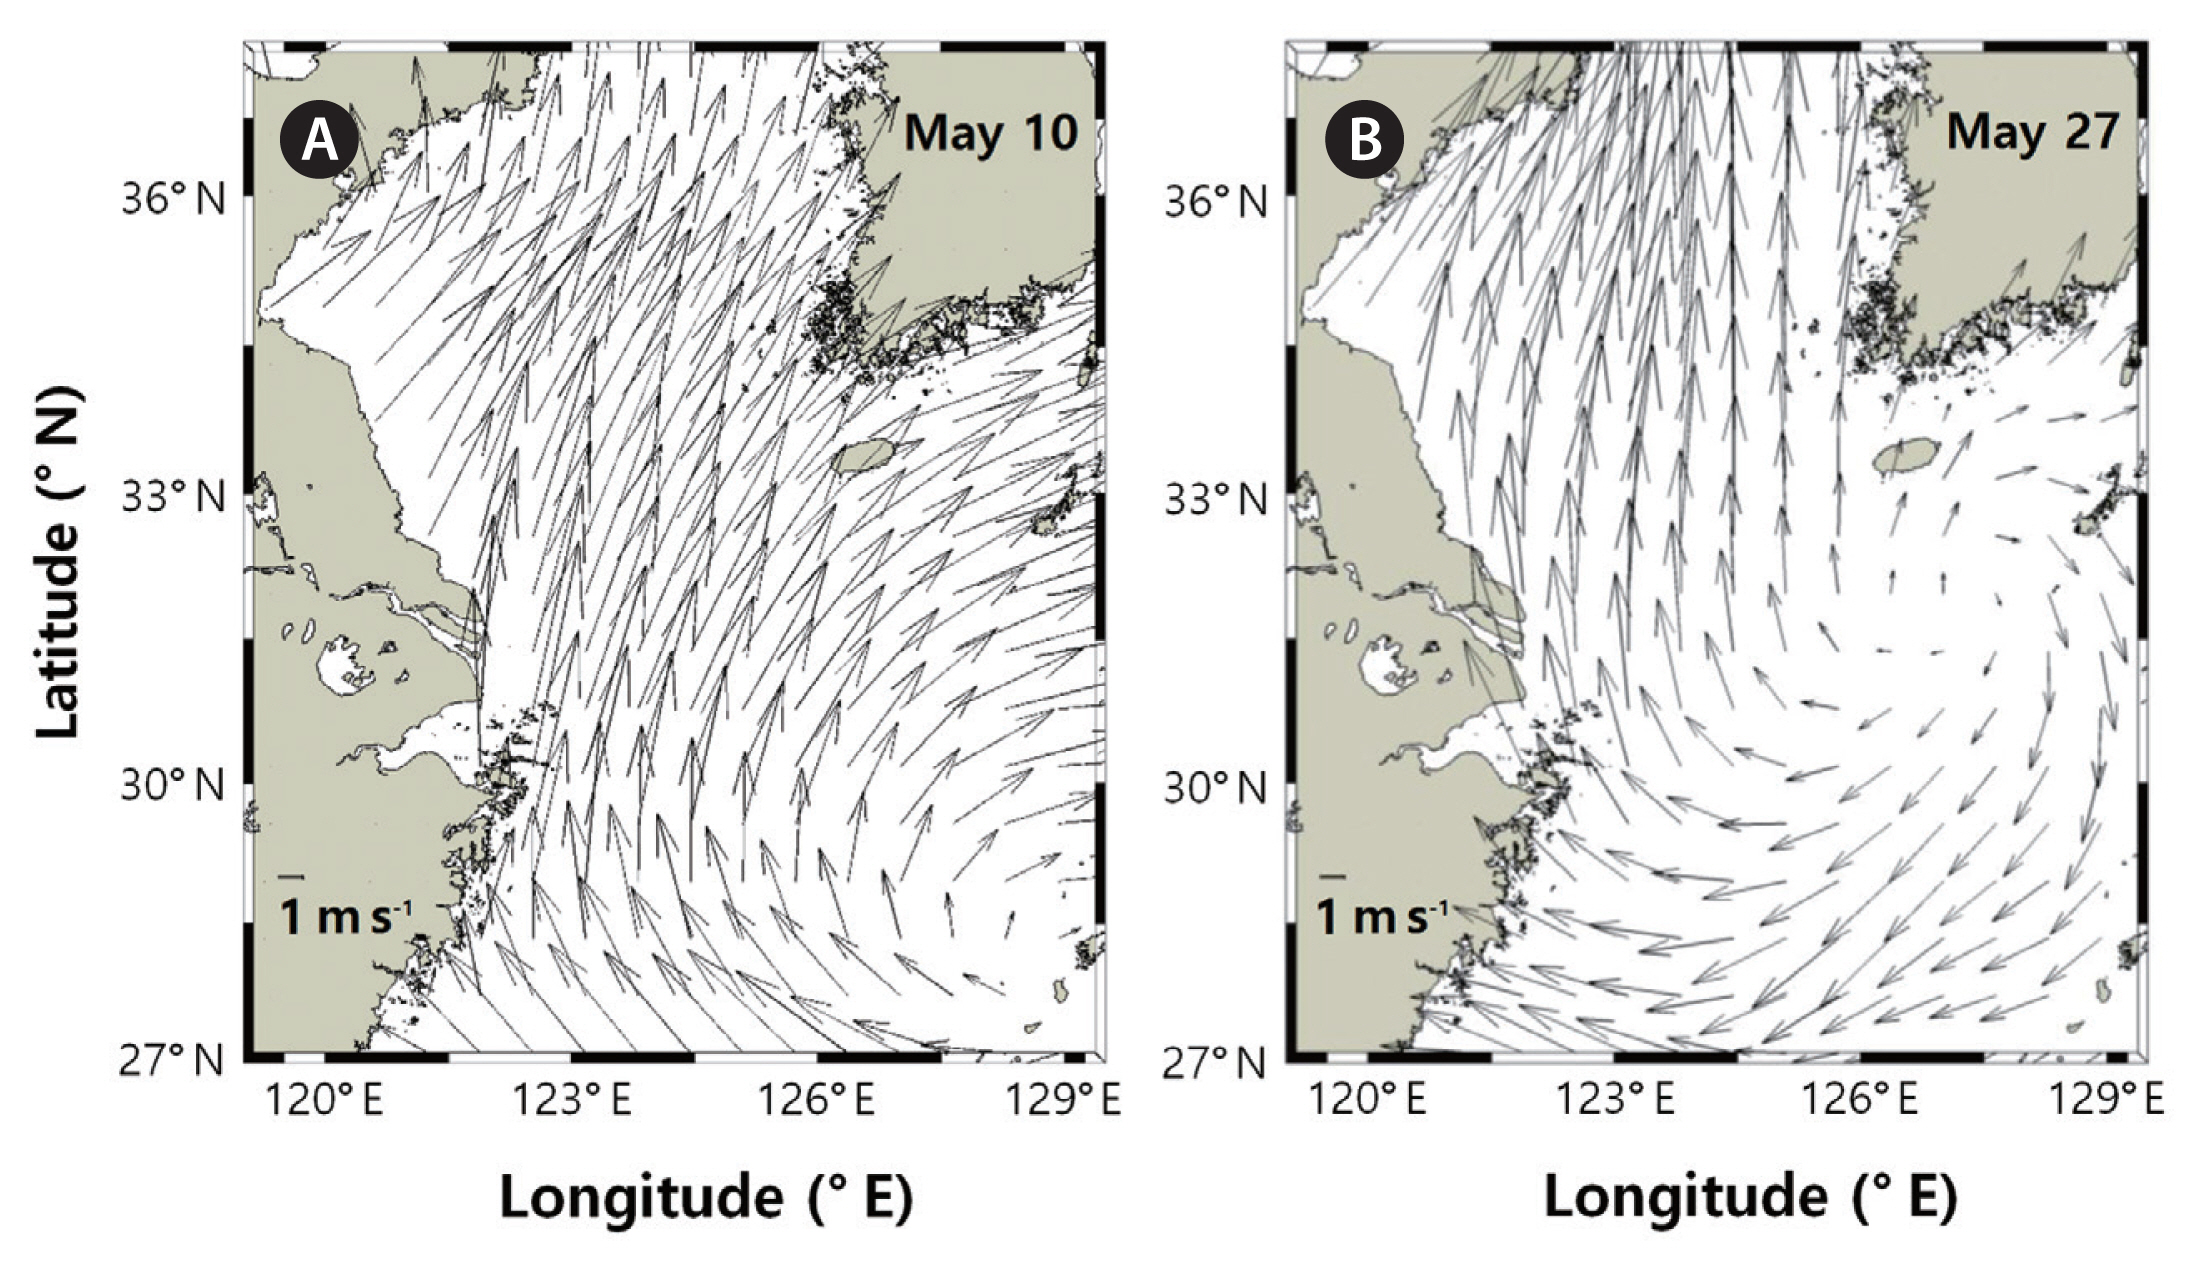
Drift of pelagic-macroalgae patches in May 2017 was controlled by winds and sea surface currents. When the windage effect was not included, the macroalgae patches moved slowly eastward in the particle tracking simulations compared with those in the satellite images (Fig. 5). Monthly mean surface currents flowed along the shelf between the Kuroshio and the shelf front and entered the Korea Strait in the south of Jeju-do in May 2017 (Fig. 9). Changjiang diluted water flowed eastward and passed through the Jeju Strait. The monthly mean surface currents in the ECS flowed northeastward, which could not make the macroalgae patches move northward as fast as observed. Northward drift of the macroalgae patches in the YS from May 18 to May 28 (Fig. 3) was enhanced by the wind field (Figs 9B & 10). Monthly mean wind speed in the middle of the YS was 200–300 cm s−1, which could induce 2–3 cm s−1 drift of macroalgae patches with a windage factor of 1%. Daily mean wind speed in the middle of the YS was 800–900 cm s−1 on May 10 and 27, which could cause 8–9 cm s−1 northward drift of the macroalgae patches.
DISCUSSION
Drift of a macroalgae patch is affected by various processes including surface currents, direct momentum transfer from winds (windage), residual transport by waves (Stokes drift), growth and mortality of macroalgae (Johnson and Richardson 1977, Monismith and Fong 2004). In previous Lagrangian particle simulations of macroalgae transport (Son et al. 2015, Putman et al. 2018, Wang et al. 2019), current fields were obtained from global ocean circulation models for the open ocean and from regional ocean models for the coastal ocean (Table 1). Subgrid-scale mixing processes have been parameterized by a random walk algorithm in the models. The effect of Stokes drift on transport of macroalgae was not been included in most previous modeling studies (Zhang et al. 2018). However, some field research activities have investigated the effect of waves, winds, and surface currents on the drift of small semi-submersible drifters in the ocean surface layer (Breivik et al. 2011, Zhang et al. 2018).
Windage was an essential factor for the dispersal of Sargassum patches in the ECS and YS in May 2017 (Figs 5 & 10). Filippi et al. (2010) and Lee et al. (2011) did not include the windage effect on transport of brown and green macroalgae in the ECS and YS in May–June 2002 and 2008, respectively. When the trajectories of green algae were traced in the YS in June and July 2011, a windage factor of 3% and windage angle of 20° to the right of the downwind direction were used (Son et al. 2015). The windage factor of 1% used in this study is within the range of windage factors (0 to 3%) used in previous studies (Table 1). Two satellite-tracked buoys, attached to drifting seaweeds, were released off Zhejiang Province and traveled eastward or northeastward to the ECS from March to June in 2005 (Komatsu et al. 2007). The trajectories of the drifting seaweeds were recorded by the satellite-tracked buoys, but the quantitative influence of wind on the drift was not investigated. Currently, the windage factor and angle are not well-determined for pelagic Sargassum (Table 1). To improve particle tracking simulations in future studies, it is necessary to estimate the windage factor and angle of macroalgae patches in field experiments (Zhang et al. 2018).
In our simulations, the biology of brown macroalgae was not taken into account (Figs 7 & 8). For short-term tracking of synthetic particles, particle tracking simulation can be conducted with the drift by currents and winds if it is assumed that there is no growth and sinking of synthetic particles (Son et al. 2015, Choi et al. 2018). However, biological aspects of macroalgae patches, such as growth and mortality, need to be added for long-term particle tracking simulations (Putman et al. 2018, Wang et al. 2019). To build accurate Sargassum biology models and combine them with Lagrangian particle tracking models, we need to collect data on growth rate, buoyancy, and sinking rate of Sargassum in the ECS and YS. Field surveys are required to measure the vertical length scale of Sargassum patches and velocity shear in the upper ocean to improve Lagrangian particle tracking models.