A novice’s guide to analyzing NGS-derived organelle and metagenome data
Article information
Abstract
Next generation sequencing (NGS) technologies have revolutionized many areas of biological research due to the sharp reduction in costs that has led to the generation of massive amounts of sequence information. Analysis of large genome data sets is however still a challenging task because it often requires significant computer resources and knowledge of bioinformatics. Here, we provide a guide for an uninitiated who wish to analyze high-throughput NGS data. We focus specifically on the analysis of organelle genome and metagenome data and describe the current bioinformatic pipelines suited for this purpose.
INTRODUCTION
Following the development of ‘first-generation sequencing’ by Frederick Sanger (Sanger et al. 1977), a new method was developed in the mid-1990s termed ‘secondgeneration sequencing’ or ‘next-generation sequencing (NGS)’ (Ronaghi et al. 1996). NGS is based on DNA amplification and detects different signals produced by the addition of individual nucleotide to the nascent DNA target (so-called ‘sequencing-by-synthesis’; SBS). Compared to Sanger sequencing, NGS technologies are characterized by massively parallel approaches, high throughput, and reduced costs. The rapid progress of NGS technology allowed for a significant increase in the size of datasets that can be used for biological research. Consequently, NGS broadened our understanding of biological phenomena.
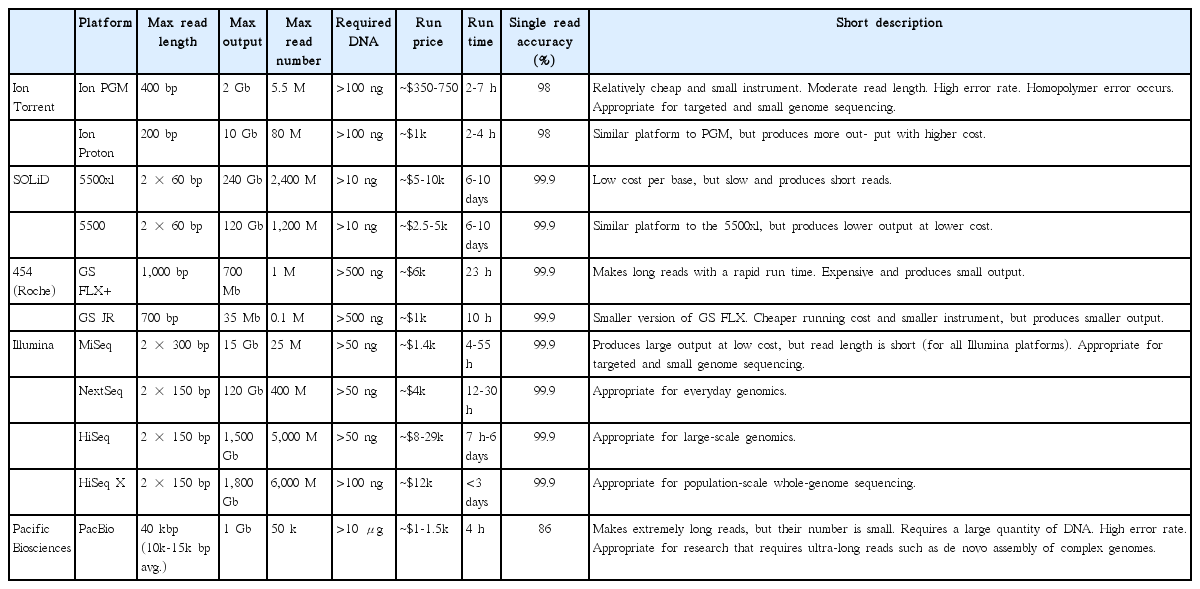
There are many kinds of NGS platforms available that have different properties (Table 1). Roche 454 and SOLiD were commercialized early on and have contributed to many research projects (Rothberg and Leamon 2008, Ludwig and Bryant 2011). However, due to the high cost, relatively long running time, and small amount of output, they have been replaced by newer platforms. Illumina (San Diego, CA, USA) is currently the most widely used system because of the large data output (15-1,800 Gbp) with low costs. Furthermore, Illumina provides a large choice of platforms from the benchtop sequencers MiSeq and MiniSeq that are suitable for smaller-scale research, to the HiSeq and HiSeq X Ten for larger-scale genomics, which are applicable for various research purposes. The Ion Torrent is specialized for individual laboratories due to its compact size and relatively low instrument price. Given the output capability (~2 Gbp) and short running time (2-7 h), the Ion Torrent personal genome machine (PGM) is largely targeted to smaller genomes such as organelle genomes or to prokaryote genome sequencing (Kim et al. 2014b, Lee et al. 2015, Yang et al. 2015). The PacBio single molecular real time sequencing (SMRT) platform is referred to as ‘third generation sequencing’ because the DNA amplification step during library preparation is no longer needed. Consequently, PacBio produces small amounts of output (up to 1 Gbp with 5 Gbp forecast by the end of 2016); however, read length is considerably longer (>10,000 bp) that advantageously differentiates it from other platforms (<400 bp). Its ultralong read is suitable for de novo construction of whole genomes (Tombácz et al. 2014) or for full-length transcriptome sequencing without assembly (ISO-Seq) (Sharon et al. 2013), and is also useful for reducing the re-sequencing step that other platforms require by filling the gaps of complex repeats in the de novo assembly (Ferrarini et al. 2013, Loomis et al. 2013, Huddleston et al. 2014).
Comparison of next-generation sequencing platforms
The development of NGS has been the driving force for major progress in biological research fields. Rapidly generated genome data allow researchers to exploit more information contained in DNA and provides additional opportunities to address profound biological questions. However, handling these high-throughput data is a challenge for beginning investigators. Given this issue, here we describe bioinformatic pipelines that are designed to analyze high-throughput data produced by NGS. Nuclear genome sequencing is not discussed in this paper because of its high complexity. In contrast, organelle genomes are relatively small and easy to handle, thus novices are able to assemble and annotate entire genomes by following relatively simple protocols. This paper introduces detailed pipelines to generate complete eukaryotic organelle genomes, as well as approaches for metagenome analysis, which provides useful information about community structure in natural environments. The methodological pipelines are summarized in Figs 1 and 2.
General strategy for organelle genome reconstruction. Several bioinformatic tools for each process are presented. BWA, Burrows-Wheeler Aligner; CDS, coding sequence; HGT, horizontal gene transfer; IDBA, iterative De Bruijn graph assembler; MIRA, Mimicking Intelligent Read Assembly; ORF, open reading frame.

General strategy for metagenomic approach. Several bioinformatic tools for each process are presented. COG, Clusters of Orthologous Group; IDBA, iterative De Bruijn graph assembler; IMG/M, Integrated Microbial Genomes and Metagenomes; MG-RAST, metagenomics Rapid Annotation using Subsystem Technology; MIRA, Mimicking Intelligent Read Assembly.
DNA PREPARATION
The first requirement of any NGS experiment is sufficient, high-quality DNA extracted from organismal tissue. The quantity and quality of DNA largely affects the sequencing results, therefore, this step is of critical importance for NGS. The minimum amount of DNA required varies depending on the platform to be used. Many Illumina protocols require >50 ng of DNA, whereas Ion Torrent platforms require 100 ng or more. PacBio platforms require a larger amount of DNA (15 μg) of high quality (not extensively fragmented) for long-read sequencing. The requirements for each platform are described in Table 1.
The basic process of DNA extraction is composed of two major steps, cell / tissue lysis followed by DNA purification (Csaikl et al. 1998). The lysis step involves cell or tissue disruption to release the DNA. To recover high amount of DNA, proper extraction methods must be used depending on the target organism. For example, in several algal species, high mucus content is a significant hurdle. Because high DNA viscosity may hinder the aggregation of binding buffer and DNA templates, this results in poor DNA yield. Manual extraction tends to leave more mucilage with DNA therefore commercial kits (e.g., DNeasy Plant Mini Kit; Qiagen, Hilden, Germany) are widely used for cells with high polysaccharide content. Furthermore, in order to remove mucilage, the cleaning process after extraction is very helpful even though it reduces DNA yield. Several commercial cleaning kits (e.g., PowerClean DNA Clean-Up Kit; Mo Bio Laboratories, Solana Beach, CA, USA) are available. Another difficulty is rigid cells. Soft tissues are easily broken in liquid nitrogen. However, several organisms with rigid cell walls such as coralline algae are hard to disrupt by grinding. Applying homogenization or bead beating with the appropriate instrument provides a solution to this problem (Lee et al. 2010, Samarasinghe et al. 2012).
Following lysis, detergents, proteins, and any other reagent should be removed. For purification, phenolchloroform extraction, ethanol precipitation, and spin column-based nucleic acid purification are the most frequently used approaches (Zeugin and Hartley 1985, Boom et al. 1990, Walsh et al. 1991). In many commercial DNA extraction kits, spin column technology is widely used because of its compatibility with standard lab equipment. Manual extraction with the phenol-chloroform method is excellent for maximizing DNA quality. This approach produces high purity and low degraded DNA but with relatively low yield. Therefore, when enough tissue samples for DNA are available the manual method is a good choice for producing high quality of DNA.
After extraction, the quality of DNA needs to be checked using gel electrophoresis. In this step, electrophoresis is performed on 0.8% tris-acetate, ethylenediaminetetra acetic acid agarose gel (50 V, 60 min). High voltage (e.g., >150 V) may heat and melt the gel and result in poor resolution. By observing the band resolution on the gel, the degree of DNA degradation and the size can be estimated. Additionally, the DNA concentration also needs to be determined. The most frequently used method for doing this is with a spectrophotometer, which measures the absorbance optical density (OD) of the solution to estimate the DNA concentration.
ORGANELLE GENOME RECONSTRUCTION
Organelle DNA contains valuable genetic information not provided by nuclear DNA such as a conserved gene content that often has a more clearly understood evolutionary history and encodes rapidly diverging sequences suited to studying species-level phylogenetic relationships (Martin and Müller 1998, Vellai et al. 1998, Ingman et al. 2000, McKinnon et al. 2001, Conklin et al. 2009). The conserved gene architecture within smaller, circular genomes makes them easier to use in studying genome level dynamics for phylogeny and evolutionary inferences (Kim et al. 2014a). Since the development of NGS technology in 2005, usage of organelle genome in research has accelerated significantly. Numerous organelle genomes have been determined: i.e., 7,644 organelle genomes are available in the NCBI database as of February 2016 (http://www.ncbi.nlm.nih.gov/genome/organelle/).
This chapter provides detailed protocols for reconstructing organelle genomes from NGS high-throughput data using computational tools without the physical isolation of organelles from cells (Fig. 1). Even though different kinds of genome sequencers are available for use, lower-throughput instruments are often better suited to small-size organelle genomes. This discussion will mainly focus on algal genome construction, although most of these protocols are also applicable to other microorganisms. Building an organelle genome is composed of five steps: 1) contig assembly, 2) identifying organelle genome contigs, 3) generating a draft genome with consensus contigs, 4) gene prediction and annotation, and 5) data analysis.
Contig assembly
NGS produces FASTQ files that contain numerous short sequences called ‘reads’ and their associated sequencing quality data. The information stored in an individual read is however limited due to its short length. Therefore, reads need to be assembled into contiguous sequences (contigs) using bioinformatic programs. There are two different approaches for assembling reads. The first is de novo assembly, whereby short reads are connected into longer sequences by overlapping reads (Paszkiewicz and Studholme 2010). This method uses an assembly algorithm that compares every possible pair of reads, therefore it is a slow process that requires high computing power. The second is reference-guided assembly, which aligns short reads to reference sequences (Gordon et al. 1998). This is faster than de novo assembly and can be performed with a smaller number of reads along with the reference sequence that should be similar to the target organism in terms of genome structure. CLC Genomics Workbench (CLC Bio, Aarhus, Denmark) and Geneious (http://geneious.com/) are commercially available and widely used programs that contain both assembly and read mapping with user-friendly interfaces. Other freely available assembly / read mapping programs are listed in Table 2.

Bioinformatic tools provide assembly / alignment function
Identifying organelle genome contigs
Assembled contig data contains a mixture of sequences encoding nuclear, organelle, and potentially contaminating DNAs. Therefore, contigs of the target organelle need to be identified. To identify all of the potential contigs of the targeted organelle, the sorting process has two steps: 1) to build a reference database with sequences of genetically close taxa and 2) to compare every contig to the reference sequences and select similar contigs based on similarity to the reference.
To build a reference database, sequence data from phylogenetically closely related taxa should be selected. Instead of downloading genome data from a single species, multiple genome data from closely related species is recommended for the reference, because genome data are still sparse from a phylogenetic point of view, and genome structure can be different even between closely related species. Hence, we use all the available algal plastid genomes as reference when we assemble a particular algal plastid genome. Reference data can be collected from the NCBI genome database (http://www.ncbi.nlm.nih.gov/genome/).
Along with the reference database, a tool for comparison between contigs and reference sequences is needed. The BLAST algorithm is useful in this respect (Altschul et al. 1997). Web-based BLAST searches are very convenient, but it is impossible to search through millions of contigs using the web interface. Thus, an automated pipeline with local BLAST is recommended. Local BLAST is a stand-alone software, which can be run on a local computer. To install the local BLAST tool, source codes and installers are available on the NCBI web site (http://www.ncbi.nlm.nih.gov/guide/howto/run-blast-local/). Any computer is capable of running local BLAST; however, for a large amount of genome data, relatively high computing power is needed (in this study, a computer with 64 cores was used to run local BLAST).
Like web BLAST, local BLAST also provides five search algorithms (blastn, blastx, blastp, tblastn, and tblastx). For contig sorting, translated amino acid sequences are more useful because nucleotide sequence comparison can only recognize homologs from very closely related species. Therefore, blastn is not recommended for this purpose. To use translated sequences, reference data should be downloaded in protein format, and contigs need to be used after translation. Among the other four algorithms, blastp and tblastx cannot be used because they compare protein-protein sequences and translated nucleotide-translated nucleotide sequences, respectively. Thus blastx and tblastn are needed to sort contigs. Blastx, however, generally makes underestimates with large genomes, thus using tblastn is generally recommended. As stated above, the blastn algorithm is not useful for identifying protein coding genes, but for rRNA sorting (because RNA does not encode amino acids), blastn is the only applicable algorithm. Local blast is operated using command lines, and detailed commands are included in the source code data (ftp://ftp.ncbi.nlm.nih.gov/blast/executables/blast+/LATEST/). The following setting for tblastn is a good starting point for beginners.
– evalue e-06 (E-value e-06 for blast alignment)
– num_threads 1 (use for the single-core calculating, change the number for the different number of cpus)
After sorting, the collected contigs need to be manually checked. Due to sequence similarity between organelle DNA with genomes of contaminant bacteria, bacterial contigs need to be identified and separated. Therefore, if the sample is highly contaminated, bacterial contigs should be filtered out using blastn or blastx.
Draft genome with consensus contig
The assembled contigs may not be the full-length organelle genome and the contigs are linear rather than the (typically) expected circular form. This indicates that the contigs are partial genome (circular / linear form can be determined by checking the end to end connection). To assemble a complete genome, the ‘re-assembly’ step using sorted contigs is required. Re-assembly can be done using de novo assemblers such as CLC or Geneious, and additional programs are listed in Table 2. De novo assembly normally works for many algal organelle genomes, but in some cases different methods should be considered. For instance, the read mapping method is more suitable for genomes with low variation like those found in the chloroplast genomes of land plant (Doorduin et al. 2011).
Once the consensus genome is assembled, several confirmation steps are needed. The first is genome size comparison to sister taxa using a sequence homology check. This step can be performed using the BLAST method and will confirm completion of the target genome. Another step is read-mapping to the consensus contig. This step will reveal the regions of the genome where more sequence data may be needed to ensure accuracy. Low read coverage (less than 50×) indicates insufficient read number or assembly error that needs to be used to inform re-sequencing or re-assembly strategies. For instance, in the PGM platform using the 318-chip we generally produce ca. 50× genome coverage for organelles from 1 Gbp of sequence data that results in a reasonable assembly. If the reads are too limited in number (i.e., less than 50× coverage), then additional sequencing should be done. The specific issues to be considered for this step, however, vary between different NGS platforms. In the case of assembly error, confirmation by highly accurate sequencing (i.e., Sanger method) or mapping with ultralong read (i.e., PacBio) can provide solutions. Specifically, due to the high frequency of repeated sequences (e.g., inverted repeats or duplicated rRNA operons), which usually results in assembly error, plastid genomes demand the utmost care. In addition, for circular genomes, connection of both ends needs to be checked by additional read mapping. If both ends are not connected, this gap must be filled using Sanger sequencing or an additional NGS run. Read mapping can be performed using available programs (e.g., CLC, Geneious, Partek, and Bowtie) including the aligning function (Table 2, Fig. 1).
Gene prediction and annotation
Once a draft genome is constructed, its constituent genes need to be identified and annotated. Before annotation, gene prediction should occur. Gene prediction is the process of identifying the regions of encoded genes that are likely to occur. This process entails translating nucleotide sequence and finding open reading frames (ORFs). Gene prediction can be performed with some computational programs such as Geneious Pro or ORF Finder (Table 3). During the prediction process, the genetic code setting must be carefully considered. Several species use different translation codons. In particular, alternative start codons significantly change the structure of predicted genes. Translation in several organelles can be initiated from codons other than ATG. For example, translation codon number 11, which is usually used for chloroplast genome, also uses TTG, CTG, ATT, ATC, ATA, and GTG as initiation codons. Many organelle genomes use altered translation codons (e.g., many algal mitochondria use 4, some green algal mitochondria use 22, many plant mitochondria use 1, and so forth), therefore, proper genetic code must be used in the genetic code data in NCBI (http://www.ncbi.nlm.nih.gov/Taxonomy/Utils/wprintgc.cgi). Originally, gene prediction requires cDNA data to identify noncoding exons. Therefore, when transcriptome data or expressed sequence tag (EST) data are available, annotations tend to be more accurate, but producing cDNA data is an expensive and time-consuming process. Furthermore, organelle genomes are generally highly conserved, thus reference-based prediction is sufficient for organelle genome annotation. Predicted ORFs are verified using a BLAST similarity search. For coding gene annotation, blastx is recommended. The blastx program compares the six-frame conceptual translated products of a nucleotide query against a protein sequence database to provide more accurate models and to detect unknown ORF sequence. Moreover, there are some automated annotation tools that are available for use (e.g., DOGMA, MITOFY, and CpGAVAS, see more in Table 3).
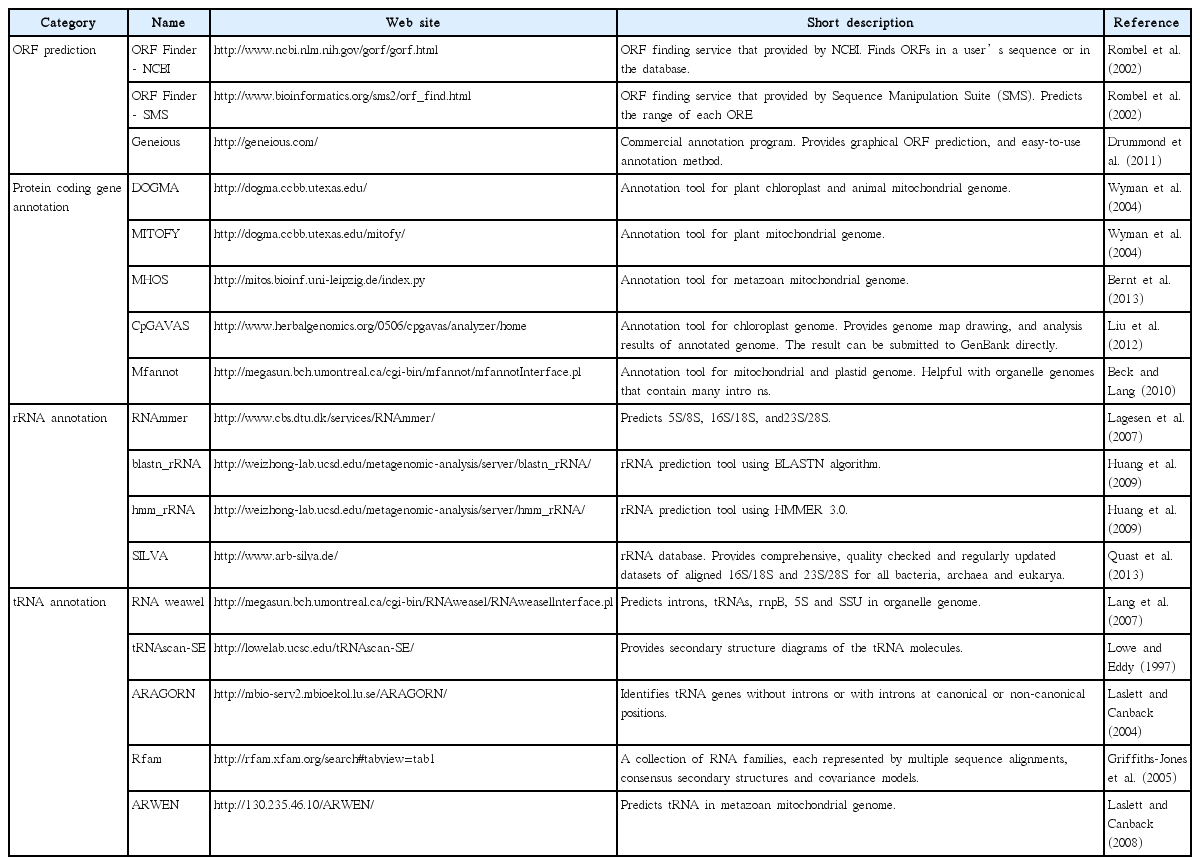
Bioinformatic tools used in gene annotation
After annotation, two things should be checked: 1) whether the lengths of the annotated genes are similar to that of the reference, and 2) whether the proper start codon was used. If nucleotide insertions / deletions exist, the stop codon may occur in the middle of a gene resulting in alteration of the length, referred to as a ‘pseudogene.’ Once all gaps and ambiguous sequences have been identified, polymerase chain reaction (PCR) confirmation is needed to correct these regions. This confirmation step, however, may not be always necessary. Sequence confirmation is generally needed for Ion Torrent or PacBio platforms, because the accuracy of these platforms (98% and 86%, respectively) (Table 1) is lower than that of other platforms such as Illumina (>99.9%). In many cases, the size of the gap is unknown, thus long-range PCR (PCR with long extension time) or primer walking (making additional primers to sequence through the gap) is also useful to fill the gap.
Because rRNA and tRNA do not encode amino acids, the annotation step described above is not applicable for these sequences. Two possible methods are widely used for non-protein coding RNA annotation. The first is using web-based tools, which provide RNA annotation services listed on Table 3. For example, ARAGORN and RNAmmer provide reasonable prediction for tRNAs and rRNAs respectively. However, some genomes are not fit for the listed programs because of the extremely high divergence of RNA, and the presence of introns in some of these genes. In this case, sequences should be manually analyzed by comparison to related species; i.e., a blastn alignment may find the corresponding rRNA or tRNA region between different genomes.
Data analysis
A completed organelle genome provides a rich source of genetic information that can be applied to diverse biological fields including systematics and evolutionary research.
Phylogenomics. Reconstructing phylogenetic tree is one of the major tools used to address taxonomic or evolutionary questions. Compared to the phylogenetic tree of a single gene, phylogeny of multiple concatenated genes from the organelle genome generally provides better resolution (Kim et al. 2014a). Conceptually, reconstructing multi-gene trees is identical to methods used for single gene data. However, before phylogenetic analysis, multi-gene sequences need to be combined into a single alignment. For this approach, every gene sequence from the organelle genomes from all target taxa should be extracted into individual files. It is ideal if all of the species contain the same set of genes, otherwise, the gene set should be manually selected. In general, genes that are present in more than 80% of the taxa set are normally chosen. For the gene selection step, the blastn algorithm (search a nucleotide database using a nucleotide query) is appropriate for nucleotide datasets, whereas the blastp algorithm (search a protein database using a protein query) is used for protein datasets. Use of nucleotide alignments might result in phylogenetic ‘noise’ from saturated silent nucleotide substitutions, thus, using protein dataset is generally recommended. Extracted sequences should be combined into a single sequence file from each species. These steps can be done manually, however, for a large set of genomes, using command lines can be useful. When using protein datasets, the correct genetic code setting for translation must be used (see above). Concatenated gene sets then are aligned into a PHY file using MAFFT (http://mafft.cbrc.jp/alignment/server/) to prepare for phylogenetic analysis. Thereafter, phylogenies can be reconstructed using various standard methods such as RaxML (Stamatakis 2006) or IQtree (Nguyen et al. 2015). These concatenated phylogenetic analysis with organelle genome have been used in many evolutionary biology studies, for example in understanding the evolution of brown algal plastids (Le Corguillé et al. 2009), in finding evolutionary evidence for organelle genome reduction (Qiu et al. 2015), and to identify useful taxonomic markers by comparing the mutation rate of organelle encoded genes (Janouškovec et al. 2013).
Structure analysis. Genome structure analysis may reveal genome-wide differences such as gene gain, loss, duplication, rearrangement or inversion of gene fragments on a genome, and lateral gene transfer. These data also provide additional information about the interrelationships of different taxa. Some bioinformatic methods such as drawing graphical maps or synteny comparison can be used for this purpose. Graphical maps of DNA sequences show the annotation information describing the gene loci, whereas synteny comparison can be used to identify large-scale changes in the genome. Genome maps can be visualized by uploading the genome sequence to web based tools such as OGDraw (http://ogdraw.mpimpgolm.mpg.de) (Lohse et al. 2007) or GenomeVX (http://wolfe.ucd.ie/GenomeVx/) (Conant and Wolfe 2008). For synteny comparison, several multiple genome aligners are available including the two widely used programs MUMmer (http://mummer.sourceforge.net/) (Delcher et al. 1999) and Mauve (http://darlinglab.org/mauve/mauve.html) (Darling et al. 2004). Structural analysis of organelle genome has contributed greatly to our understanding of organelle genome evolution. For example, searching for horizontal gene transfer in red algal genomes (Qiu et al. 2013), the origin of red algal plasmids (Lee et al. 2016), organelle genome conservation (Yang et al. 2015) and recombination (Maréchal and Brisson 2010), the finding of introns within tRNA, which encodes a plastid intron maturase (Janouškovec et al. 2013) have indicated the utility of organelle genome structure analysis.
METAGENOME ANALYSIS
The term ‘metagenome’ refers to the ‘collective genomes of environmental microflora,’ which are directly isolated from an environmental sample (Handelsman et al. 1998). Metagenomics is the study of microbial organisms using genome sequence data derived from environments such as soil, marine water, air, or sediment cores. Essentially, metagenomic analysis focuses on the full characterization of the natural population, which addresses community composition, their functional dynamics and relative abundance among different environments or different time points (Scholz et al. 2012). Technological advances in NGS fueled a revolution in metagenomic sequencing and analysis. Increased throughput and cost-efficiency coupled with additional technological advances have extended the importance of metagenomics. This technological development allowed more comprehensive investigation of diverse microbial communities of extreme complexity such as human gut (Weinstock 2012), global ocean microbiome (Sunagawa et al. 2015), and palaeomicrobiome (Warinner et al. 2015). Given the enormous sequencing data, the advanced computational methods are required, and recently, several systems and tools have been developed to apply in the analysis of complex metagenome datasets (Mocali and Benedetti 2010).
Here, we describe methodological approaches for high-throughput metagenome sequence analysis (Fig. 2). There are two general types of analysis depending on the research aim. If the research aims at reconstructing the genome from a mixture of multiple organism sequences, and the reads are enough to recover entire genome, 1) contig assembly is needed to construct genomic contigs. Whereas, to profile the community structure, 2) taxonomic / functional assignment to the individual reads or short contigs (functional annotation) is the suitable method. Furthermore, comparative analysis among different metagenomes will allow opportunities to address the relationship between different communities.
Contig assembly
If the purpose of the study is to recover the genome or full-length coding sequence (CDS) for genome level analysis from metagenome data, then short-read sequence data should be assembled into longer genomic contigs. High-throughput metagenome sequencing data include DNAs from numerous organisms of varied abundance. This unevenness of coverage makes it difficult to reconstruct contigs or genomes, moreover, chimeric assembly, caused by the similarity of closely related lineages further complicates the process. For these reasons, major de novo assemblers, which were designed to assemble single or clonal genomes, are not suited to the assembly of metagenomes with abundant heterogeneous sequences, and thus, their performance with metagenomic data sets varies significantly (Kunin et al. 2008). Therefore, many assemblers capable of assembling metagenome data have been developed, including MetaVelvet, IDBAUD, MEGAHIT, and RayMeta (Table 4), although they are still at an early stage of development (Scholz et al. 2012, Thomas et al. 2012). Unlike traditional single genome assemblers, metagenome assemblers adopted the de Bruijn graph approach, which is reasonable for DNA assembly from mixed sequence of multiple species (Namiki et al. 2012).
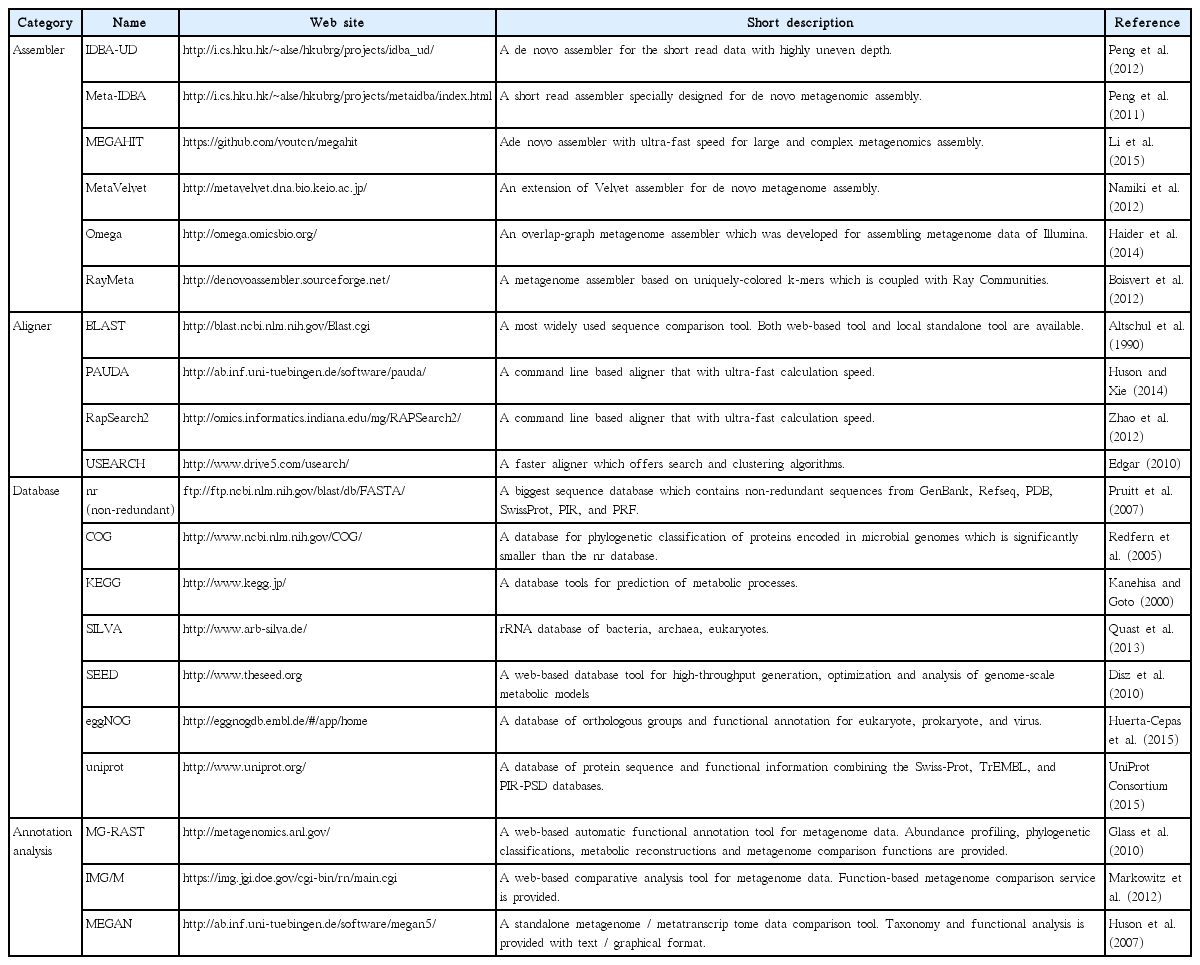
Bioinformatic tools used in metagenome analysis
Once the contigs are obtained, there are two possible approaches to analyze them: 1) genome construction and 2) contig annotation. If the sequences are sufficient to construct the whole genome, de novo assemblers are applied (Table 2). However, for many cases, genome construction is highly restricted due to the poor coverage of each taxon and the unevenness of community composition. If the target genome sequence is available, direct read mapping onto the reference sequence (referencebased assembly) is another approach (Table 2). Otherwise, the annotation process of individual contigs is suitable for community profiling. Based on the annotation data, the overall taxonomic composition and functional diversity of the given environment can be profiled. Annotation issues are discussed in the subsequent section.
Functional annotation
If the purpose of the study is to explore environmental community characterization, including taxonomic classification and functional diversity, direct annotation to the reads or contigs is a suitable approach; this is referred to as functional annotation. Essentially, functional annotation is focused on three questions: 1) who is living there, 2) what are they doing, and 3) how do they differ from each other (Mitra et al. 2011)? Addressing ‘who is living there?’ is based on investigation of the microbial community structure. It includes efforts to survey which taxa are included in the community, and how their composition is distributed. The question ‘what are they doing?’ addresses which functional genes are contained in the microorganisms of the environment, surveys relative abundance of each functional group, and ultimately focuses on understanding functional dynamics in the given environment by reconstructing the metabolic pathway. The third approach ‘how do they differ?’ relies upon comparing the different metagenome (community). The metagenome comparison has contributed to understanding the biological meaning by revealing the population level differences in multiple environments or population change process over time.
Basically, metagenomic functional annotation means classifying sequences into known functions or operational taxonomic units (OTUs) based on homology searches against existing reference data. Therefore, in general, annotation of metagenomic sequence data requires two kinds of bioinformatic tools: 1) a homology search program and 2) a reference database. Details of this process vary depending on the type of aligners, but the overall steps for functional annotation are similar. First, the library needs to be constructed using a reference database. Then, individual reads are searched against the database using a homology search, and eventually, each is labeled with a taxonomic classification and functional group assignment. For the similarity search, considering the size of the sequence data and computational resources, an appropriate aligner must be used. Conceptually, the annotation is a simple process, so for the very small datasets (<10,000 sequences), manual curation can be used for better accuracy (Thomas et al. 2012). However, because metagenomic datasets are typically very large, automated annotation tools are recommended. Local BLAST is a highly accurate method as well (Scholz et al. 2012), but it requires significant calculation times. Therefore only if the sequence data is relatively small or computer resource is sufficient, local BLAST will be the best for similarity search. For more rapid work, PAUDA or RapSearch2 provide good alternatives. PAUDA is based on the bowtie aligner and shows extremely rapid calculation speed. RapSearch2 also provides a rapid speed of annotation (Table 4). For the calculation speed comparison, when annotating millions of reads using 40 cores of CPU, local BLAST takes several days, whereas PAUDA and RapSearch2 complete the work within a day. Along with the aligner, a suitable reference database is necessary. Many databanks are available, which provide reference sequence datasets for functional / taxonomic information assignment such as nr (non-redundant), Clusters of Orthologous Group (COG), Kyoto Encyclopedia of Genes and Genomes (KEGG), SEED, and so forth (Table 4). The nr database contains the greatest number of sequences (43 GB), however, because every reference sequence should be individually compared to each of the reads, considerable CPU time is required. COG, SEED, or uniprot contain smaller amounts of sequences than the nr database (only functionally identified sequences are included), thus provide rapid homology search with less computer power. KEGG database provides prediction of cellular metabolic processes, which is specialized for functional profiling. Because each reference databank contains different types of sequence sets, selecting proper database depending on the research aim is of critical for accurate population profiling. More detailed information of each databank is presented in the Table 4.
Once the annotation is complete, the result needs to be visualized for community profiling or community comparison. MEGAN is a great tool for visualization of annotation results. MEGAN analyzes the taxonomic content by placing the annotated reads onto the NCBI taxonomy, while functional distribution is analyzed by mapping the reads to the three different functional classifications (SEED, COG, and KEGG) (Huson and Weber 2013). This program supports various kinds of input file formats (BLAST, SAM, RDP, Silva, CSV, and BIOME) produced by alignment of the reads to a reference sequence database. Then the graphical and statistical output for each metagenome or the comparison of multiple metagenomes is created. However, due to the high requirement of computer resources, such a standalone analysis has limits for the researchers without an access to high performance computers.
For large-scale databases, web-based analysis tools such as Metagenomics Rapid Annotation using Subsystem Technology (MG-RAST) and Integrated Microbial Genomes and Metagenomes (IMG/M) provide powerful solutions, because these web portals offer large computational resources for data analysis. These servers have the automated analysis platforms, which are specialized for metagenome data. MG-RAST pipeline provides many analysis services including quality control, functional annotation, taxonomic assignment, metabolic pathway reconstruction and comparison of multiple metagenomes (Meyer et al. 2008). To use these services, sequencing data should be uploaded to the pipeline on the server. The raw sequence data formats such as FASTA or FASTQ are acceptable. The uploaded sequences then are normalized and annotated against the database that integrates information from several tools, including M5NR, Gen- Bank, SEED, KEGG, SwissProt, M5RNA, Greengenes, and so forth. The analysis time alters from a few hours to a few weeks depending on the importance of the research theme and the size of the data. The results are produced in the form of organism / functional abundance profiles and are visualized in various formats (bar chart, tree, table, heat map, and so forth). Beyond the annotation, MGRAST also provides comparative metagenomics tools. Users can use multiple data for metagenome comparison with lots of statistical analyses such as phylogenetic / metabolic reconstruction and abundance profiling. MGRAST has more than 230,000 uploaded metagenomes (of which 32,000 are publicly accessible) and 97 Terabases of sequences at February 2016. IMG/M also provides similar analysis pipeline including automated genome annotation, individual metagenome abundance profiling, and comparative metagenomics (Markowitz et al. 2012).
Despite the development of diverse analysis tools, functional annotation is still restricted by several limitations. Short read length has the possibility of a higher error rate. Assembled contigs are better for the length, but typically, large contigs are difficult to attain due to the technological limitations in DNA recovery and sequencing capacity (Scholz et al. 2012). Furthermore, due to the immense amount of sequence data, long computation times and sufficient hardware resources are required for the individual annotation of every read. In contrast, a limited amount of reference data makes it hard to confirm the accuracy of metagenomic data. Nevertheless, functional annotation has greatly contributed to understanding microbial community profiles such as the diversity of prokaryotes in surface ocean waters (Biers et al. 2009), the human gut microbiome (Qin et al. 2010), or metabolic dynamics in lacustrine ecosystems (Debroas et al. 2009). Furthermore, comparison of multiple communities (metagenomes) can reveal differences between environments or species composition at various time points. Metagenome comparison approach is of great importance for extending our understanding of the environment- driven effect on microbiota or the transition process of community structure over time. There are several examples of note. Sunagawa et al. (2015) investigated the change in oceanic microbial composition along with vertical stratification, which then revealed the impact of temperature on community variation; Warinner et al. (2015) studied the evolution of the microbial populations in the human body, and contributed to the evolutionary understanding of microbial population transition processes; the Human Microbiome Project Consortium (2012) revealed differences in microbiome community structure between different anatomical sites, individuals, or physical conditions, which can help describe healthy microbiome status in the human body; Jung et al. (2011) explored the changes in bacterial populations and functional dynamics during the fermentation of kimchi. All of these studies have provided valuable information, which has extended our understanding in the fields of ecology, evolution, and medical science.
CONCLUSIONS
We have described two classes of bioinformatic approaches that should prove helpful to beginners who wish to analyze high-throughput NGS data. The discussion of organelle genome reconstruction and analysis pipelines provides the necessary framework for researchers to greatly expand existing plastid and mitochondrial databases. In contrast, metagenome analysis is a useful approach for addressing whole community structure in natural settings. Both of these computational methods will be of great value to biologists interested in the application of high-throughput genome data to various fields of research from phylogenetics to ecosystem analysis.
Acknowledgements
This work was supported by the Polar Academic Program of the Korea Polar Research Institute (KOPRI), the Korean Rural Development Administration Next-generation BioGreen21 (PJ011121), the National Research Foundation of Korea (MEST: 2014R1A2A2A01003588), and Marine Biotechnology Program (PJT200620) funded by Ministry of Oceans and Fisheries, Korea to HSY and MR.