Lim, Jeong, Ah Seong, Lee, Kang, Jang, Lee, Park, Jang, and Yoo: Ichthyotoxic Cochlodinium polykrikoides red tides offshore in the South Sea, Korea in 2014: II. Heterotrophic protists and their grazing impacts on red-tide organisms
ABSTRACT
Occurrence of Cochlodinium polykrikoides red tides have resulted in considerable economic losses in the aquaculture industry in many countries, and thus predicting the process of C. polykrikoides red tides is a critical step toward minimizing those losses. Models predicting red tide dynamics define mortality due to predation as one of the most important parameters. To investigate the roles of heterotrophic protists in red tide dynamics in the South Sea of Korea, the abundances of heterotrophic dinoflagellates (HTDs), tintinnid ciliates (TCs), and naked ciliates (NCs) were measured over one- or two-week intervals from May to Nov 2014. In addition, the grazing impacts of dominant heterotrophic protists on each red tide species were estimated by combining field data on red tide species abundances and dominant heterotrophic protist grazers with data obtained from the literature concerning ingestion rates of the grazers on red tide species. The abundances of HTDs, TCs, and NCs over the course of this study were high during or after red tides, with maximum abundances of 82, 49, and 35 cells mL−1, respectively. In general, the dominant heterotrophic protists differed when different species caused red tides. The HTDs Polykrikos spp. and NCs were abundant during or after C. polykrikoides red tides. The mean and maximum calculated grazing coefficients of Polykrikos spp. and NCs on populations of co-occurring C. polykrikoides were 1.63 d−1 and 12.92 d−1, respectively. Moreover, during or after red tides dominated by the phototrophic dinoflagellates Prorocentrum donghaiense, Ceratium furca, and Alexandrium fraterculus, which formed serial red tides prior to the occurrence of C. polykrikoides red tides, the HTDs Gyrodinium spp., Polykrikos spp., and Gyrodinium spp., respectively were abundant. The maximum calculated grazing coefficients attributable to dominant heterotrophic protists on co-occurring P. donghaiense, C. furca, and A. fraterculus were 13.12, 4.13, and 2.00 d−1, respectively. Thus, heterotrophic protists may sometimes have considerable potential grazing impacts on populations of these four red tide species in the study area.
Key words: ciliate; dinoflagellate; grazing impact; harmful algal bloom
INTRODUCTION
Red tides, or harmful algal blooms, occur in coastal waters worldwide ( Holmes et al. 1967, Eppley and Harrison 1975, Franks and Anderson 1992, Anderson 1995, Horner et al. 1997, Sordo et al. 2001, Imai et al. 2006, Seong et al. 2006, Jeong et al. 2015), and often result in large-scale fish and shellfish mortalities and substantial economic losses to the aquaculture and tourist industries ( Smayda 1990, Glibert et al. 2005, Anderson et al. 2012, Fu et al. 2012, Park et al. 2013b). In particular, the ichthyotoxic dinoflagellate Cochlodinium polykrikoides forms red tides in the waters of many countries, and has been shown to cause large-scale mortality of finfish in both cages at sea and aqua-tanks on land ( Whyte et al. 2001, Fukuyo et al. 2002, Gobler et al. 2008, Mulholland et al. 2009, Kudela and Gobler 2012, Park et al. 2013b, Lim et al. 2014a, 2017, Hong et al. 2016). Thus, to minimize the economic losses resulting from red tides, many countries attempt to predict and control such events. The growth rate of red tide species and its mortality rate due to predation are two critical parameters in prediction models ( Jeong et al. 2015), but there is far less data available on the mortality rates of red tide species due to predation than on growth rates. Thus, to improve predictions of red tide outbreaks, persistence, and decline, it is useful to investigate the roles of heterotrophic protists in red tide dynamics, including the mortality rates of red tide species due to predation by heterotrophic protists. Heterotrophic protists, such as heterotrophic dinoflagellates and ciliates, are often abundant during or after red tides ( Hansen 1991, Nakamura et al. 1995, Yoo et al. 2013a). Moreover, several phytoplankton species belonging to various taxonomic groups sometimes form red tides simultaneously or in serial during a certain period of time ( Jeong et al. 2013, 2017); for example, diatoms and the phototrophic dinoflagellates Prorocentrum donghaiense, Ceratium furca, Alexandrium fraterculus, and C. polykrikoides formed serial red tides in Korea’s South Sea in 2014 ( Jeong et al. 2017). This raises the question of whether the dominant heterotrophic protists also differ during different red tides. Furthermore, many heterotrophic protist species or groups are known to be effective grazers on red tide species, and grazing by heterotrophic protists often restricts the initial development of red tides and contributes to red tide termination ( Lessard 1991, Montagnes and Lessard 1999, Calbet et al. 2003, Jeong et al. 2005, 2010, 2015, Turner 2006, Sherr and Sherr 2007, Yoo et al. 2013a, Jang et al. 2016). For instance, several heterotrophic protists, such as the ciliates Strombidinopsis spp., the heterotrophic dinoflagellate Polykrikos kofoidii, and the mixotrophic dinoflagellates Alexandrium pohangense and Polykrikos hartmannii, are known to feed on C. polykrikoides ( Jeong et al. 1999, 2001, 2008, Kim 2004, Lee et al. 2015, Lim et al. 2015, 2017). However, a few studies have focused on the impacts of grazing by heterotrophic protists on populations of C. polykrikoides ( Kim 2004, Yoo et al. 2013a), and none on populations of P. donghaiense and A. fraterculus. Thus, it is worthwhile to explore the impacts that grazing by heterotrophic protists have on these red tide species. To investigate the roles of heterotrophic protists in red tide dynamics in the South Sea of Korea, the abundances of heterotrophic dinoflagellates (HTDs), tintinnid ciliates (TCs), and naked ciliates (NCs) in water samples collected from 2–5 different depths (depending on the overall water depth) at 60 stations (mostly offshore) weekly or every two weeks from May to Nov 2014 were measured. Environmental factors, such as water temperature, salinity, and chlorophyll- a (chl- a), and the abundances of dominant red-tide organisms, were simultaneously analyzed in a companion paper ( Jeong et al. 2017). The grazing impacts by dominant heterotrophic protists on each red tide species were estimated by combining field data of red tide species and dominant heterotrophic protist grazer abundances with data obtained from the literature regarding grazer ingestion rates of the red tide species. The results of the present study provide a basis for understanding the role of heterotrophic protist grazers in red tide dynamics.
MATERIALS AND METHODS
Study area and sampling stations
The 60 stations used for sampling in the study area were located in the mid and eastern South Sea of Korea. Water depths at the sampling stations ranged between 4 and 53 m ( Fig. 1). The depths of the stations in the western South Sea are shallower than those in the eastern South Sea at the same latitude ( Fig. 1). One of the estuary stations was located ca 20 km south of the mouth of the Seumjin River, whereas the other estuary station was located 5 km southwest of Haechang Bay. Sixteen sampling time cruises were conducted at 1–2 week intervals from May to Nov 2014. Two days of sampling were undertaken during each cruise; on each day, two ships simultaneously collected water samples at half of the stations in the study area. Water temperatures and salinities throughout the water column were measured using 2 CTDs (YSI6600; YSI Inc., Yellow Springs, OH, USA; Ocean seven; Idronaut S.r.l., Milan, Italy). The data obtained using the CTDs were calibrated each cruise. In addition, when each water sample was taken, the temperature, salinity, pH, and dissolved oxygen (DO) in the sampling waters were measured using a YSI Professional Plus instrument (YSI Inc.). The chl- a concentration was measured in accordance with the protocol described in Eaton et al. (1995).
Abundances of heterotrophic protists
Water samples at each station were taken from 2–5 m depths depending on the depth with water samplers. Plankton samples were poured into 500-mL polyethylene bottles and preserved with acidic Lugol’s solution for determination of heterotrophic protist abundances. To determine the abundances of HTDs, TCs, and NCs, the samples preserved in acidic Lugol’s solution were concentrated by 1/5–1/10 using the settling and siphoning method ( Welch 1948). After thorough mixing, all or a minimum of 100 cells of each protist species in one to ten 1-mL Sedgwick-Rafter counting chambers were counted under a compound microscope. Data on the abundances of phototrophic protists were obtained from Jeong et al. (2017). The average and maximum values of the abundance of each protist group, water temperature, salinity, and concentration of chl-a on each sampling date were derived from all water samples collected on the sampling date.
Pearson’s correlation was used to calculate the correlation coefficients between heterotrophic protists and physical and red tide organisms (IBM SPSS statistics 23; IBM Corp., Armonk, NY, USA).
Grazing impacts
The grazing coefficients (g) attributable to a dominant heterotrophic protist feeding on a co-occurring red tide dinoflagellate were calculated by combining field data on the abundance of the dominant heterotrophic protist and red tide dinoflagellate with ingestion rates of the protist grazer on the red tide prey obtained from the literature ( Jeong et al. 1999, 2001, Kim 2004, Kim and Jeong 2004, Yoo et al. 2013b, Zhang et al. 2015). The combination of a red tide dinoflagellate and dominant heterotrophic protist grazer in the study period was C. polykrikoides and NCs (>100 μm in cell length) and P. kofoidii, C. furca and P. kofoidii, A. fraterculus and Gyrodinium dominans/ G. moestrupii, and P. donghaiense and G. dominans/ G. moestrupii, Noctiluca scintillans, and NCs (>100 μm in cell length) ( Jeong et al. 2017, this study). The ingestion rate of NCs (>100 μm) on C. polykrikoides was assumed to be the same as that of Strombidinopsis sp. on C. polykrikoides ( Jeong et al. 1999). It was difficult to distinguish G. moestrupii, G. dominans, and other Gyrodinium spp. (<40 μm) from one another under a light microscope due to their morphological similarities ( Yoo et al. 2013b). Thus, the ingestion rates of G. moestrupii, G. dominans, and other Gyrodinium spp. (<40 μm) on P. donghaiense were assumed to be the same as that of G. dominans on Prorocentrum minimum, because the cell size and shape of P. minimum and P. donghaiense are similar ( Kim and Jeong 2004, Cai et al. 2006). The ingestion rate of NCs (>100 μm) on P. donghaiense was assumed to be the same as that of Strombidinopsis sp. on P. minimum ( Jeong et al. 1999). Finally, the ingestion rate of G. moestrupii, G. dominans, and other Gyrodinium spp. (<40 μm) on A. fraterculus was assumed to be the same as that of G. moestrupii on Alexandrium minutum ( Yoo et al. 2013b). The grazing coefficient (g, d−1) was calculated as:
where CR is the clearance rate (mL predator−1 h−1) for a predator of a red-tide organism at a given prey concentration and GC is the predator concentration (cells mL−1). CR values were calculated as:
where IR is the ingestion rate (cells eaten preator −1 h −1) of the predator on the prey and x is the prey concentration (cells mL −1). CR values were corrected using Q 10 = 2.8 ( Hansen et al. 1997) because the in situ water temperatures and the temperatures used in the laboratory for the experiment were different. The percentage (%) of a red-tide organism population consumed by a predator population in 1 day was calculated as:
RESULTS
Temporal variations in major environmental factors and heterotrophic protists
Average water temperatures ranged between 15.0–23.2°C during the study period, with a peak observed on Sep 28. Average salinity ranged between 32 from 34, with the lowest levels observed on Sep 1 ( Fig. 2). Concentrations of chl- a ranged from 0.1–44.2 mg m −3, with averages ranging from 1.2–3.0 mg m −3 ( Fig. 2). Peaks for both the maximum and average concentrations of chl- a were recorded on Sep 1 ( Fig. 2). Three-dimensional distributions of water temperature, salinity, chl- a concentration, and heterotrophic protists in the study area are provided in Appendix 1. Thirty-five TC taxa, several NC taxa, and 30 HTD taxa were found at all stations over the study period ( Appendix 2). Although the maximum abundances of TCs (49.0 cells mL −1), NCs (35.0 cells mL −1), and HTDs (82.4 cells mL −1) did not differ substantially from one another, the peak abundances of these 3 groups occurred at different times ( Table 1, Fig. 2); TCs and NCs abundances were highest in May to Jun, whereas that of HTDs was highest in Sep. Maximal abundances of TCs and NCs were observed when the diatom or the dinoflagellate P. donghaiense formed red tides, whereas the maximal HTD abundance was observed following peak chl- a concentrations and C. polykrikoides red tides ( Fig. 2). The abundance of total ciliates was 0–50.6 cells mL −1 ( Table 1, Fig. 2), and the maximum abundance of total ciliates was observed on May 7.
Spatial variations in major heterotrophic protists
When considering locations where high abundances were observed, the spatial distributions of TCs, NCs, and HTDs differed from one another at all sampling times with the exception of the period Jun 12 to Jul 1, 2014 ( Fig. 3). High abundances of TCs was observed in the western part of the study area at most sampling times; high abundances of NCs was observed in the western or middle parts of the study area at most sampling times; and high abundances of HTDs was observed in the eastern part of the study area from May 7–Jun 5 and Aug 6–Sep 15, but in the western or middle parts of the study area from Jun 12–Jul 1.
Temporal and spatial variations in the abundance of dominant HTDs during red tides
Diatoms, P. donghaiense, C. furca, A. fraterculus, and C. polykrikoides formed serial red tides in the study area from May 7 to Nov 11 in 2014 ( Fig. 4, redrawn from Jeong et al. 2017). In general, the dominant HTD genera during or after each red tide changed ( Fig. 4); Gyrodinium spp. were abundant during the red tide dominated by P. donghaiense from Jun 23–Jul 1, Protoperidinium spp. during the C. furca, and C. polykrikoides red tide on Aug 6 and Sep 1, and N. scintillans and Polykrikos spp. during the C. polykrikoides red tide on Sep 15. The maximum abundances of Gyrodinium spp., Protoperidinium spp., N. scintillans, and Polykrikos spp. were 41.9, 11.0, 30.7, and 78.8 cells mL −1, respectively. The spatial distributions of Gyrodinium spp., Protoperidinium spp., N. scintillans, and Polykrikos spp. differed from one another at most sampling times ( Fig. 5); Gyrodinium spp. were highly abundant in all three parts of the study area (i.e., the eastern part from May 7 to Jun 5, the western part from Jun 12 to 23, and the middle part on Jul 1); Protoperidinium spp. were highly abundant in the western or middle parts at most sampling times; N. scintillans was most abundant in the middle part of the study area; and Polykrikos spp. were abundant in all three sections (from Jun 12–Jul 1 in the western part, from Jul 11–Aug 6 in the middle part, and on Sep 15 in the eastern part) of the study area.
Correlations between major heterotrophic groups and physical and biological properties
There was a significantly positive correlation between TCs abundance and water temperature (T), whereas NCs abundance was significantly negatively correlated with T ( Table 2) but significantly positively correlated with salinity (S) ( Table 2). No correlations were found between HTDs abundance and T or S ( Table 2). The abundances of TCs, NCs, and HTDs were significantly and positively correlated with total phytoplankton, diatom, and phototrophic dinoflagellate abundances ( Table 2). Furthermore, Polykrikos spp. abundances were significantly positively correlated with C. polykrikoides abundance, whereas Gyrodinium spp. abundances were significantly positively correlated with P. donghaiense abundance. In addition, the abundances of Protoperidinium spp ., N. scintillans, TCs, and NCs were significantly positively correlated with total diatom and P. donghaiense abundances ( Table 2).
Grazing impacts on red-tide organisms
When the abundances of C. polykrikoides and P. kofoidii were 0.1–2,989.3 cells mL −1 and 0.0–27.0 cells mL −1, respectively, the calculated g attributable to P. kofoidii on co-occurring C. polykrikoides were up to 7.02 d −1 (i.e., up to 99% of the population C. polykrikoides were consumed in 1 d) (mean ± SE = 0.06 ± 0.01 d −1, n = 1,682) ( Table 3, Fig. 6). In addition, when the abundances of C. polykrikoides and NCs (>100 μm) were 0.1–2,989.3 cells mL −1 and 0.0–7.4 cells mL −1, respectively, the g attributable to NCs (>100 μm) on co-occurring C. polykrikoides were up to 12.92 d −1 (i.e., up to 99% of the population C. polykrikoides were consumed in 1 d) (mean ± SE = 0.21 ± 0.02 d −1, n = 1,682) ( Table 3, Fig. 7). When the abundances of P. donghaiense and G. dominans/ G. moestrupii were 0.1–4,369.1 cells mL −1 and 0.0–15.0 cells mL −1, respectively, the g attributable to G. dominans/ G. moestrupii on co-occurring P. donghaiense were up to 0.58 d −1 (i.e., up to 44% of the population P. donghaiense were consumed in 1 d) (mean ± SE = 0.02 ± 0.00 d −1, n = 868) ( Table 4). When the abundances of P. donghaiense and N. scintillans were 0.1–4,369.1 cells mL −1 and 0.0–30.7 cells mL −1, respectively, the g attributable to N. scintillans on co-occurring P. donghaiense were up to 1.70 d −1 (i.e., up to 82% of the population P. donghaiense were consumed in 1 d) (mean ± SE = 0.02 ± 0.01 d −1, n = 868) ( Table 4). Furthermore, when the abundances of P. donghaiense and NCs (>100 μm) were 0.1–4,369.1 cells mL −1 and 0.0–7.2 cells mL −1, respectively, the g attributable to NCs (>100 μm) on co-occurring P. donghaiense were up to 13.12 d −1 (i.e., up to 99% of the population P. donghaiense were consumed in 1 d) (mean ± SE = 0.40 ± 0.04 d −1, n = 868) ( Table 4). When the abundances of C. furca and P. kofoidii were 0.1–400.4 cells mL −1 and 0.0–15.4 cells mL −1, respectively, the g attributable to P. kofoidii on co-occurring C. furca were up to 4.13 d −1 (i.e., up to 98% of the population C. furca were consumed in 1 d) (mean ± SE = 0.02 ± 0.00 d −1, n = 1,304) ( Table 5). When the abundances of A. fraterculus and co-occurring G. dominans/ G. moestrupii were 0.1–1,276.0 cells mL −1 and 0.0–15.0 cells mL −1, respectively, the g attributable to the HTD G. dominans/ G. moestrupii on co-occurring A. fraterculus were up to 2.00 d −1 (i.e., up to 87% of the population A. fraterculus were consumed in 1 d) (mean ± SE = 0.06 ± 0.01 d −1, n = 732) ( Table 6).
DISCUSSION
Our results clearly demonstrated that (1) the type and abundance of red tide species affect the type and abundance of the dominant heterotrophic protists and (2) some heterotrophic protists had considerable grazing impacts on populations of the red tide species inhabiting the South Sea during the study period.
Effects of red tide species on the distributions of major heterotrophic protist groups
Significantly positive correlations between HTDs, TCs, and NCs and total phytoplankton abundance suggest that the abundances of these heterotrophic protists are affected by total phytoplankton abundance in the study area. However, the dominant heterotrophic protist genera or taxa differed when the red tide causative species changed; TCs and/or NCs were dominant during or after diatom red tides; Gyrodinium spp. were dominant during or after P. donghaiense red tides; Protoperidinium spp. were dominant during or after C. furca, A. fraterculus, and/or C. polykrikoides red tides; and N. scintillans and Polykrikos spp. were dominant during or after C. polykrikoides red tides. High abundances of TCs and/or NCs during or after diatom red tides, Protoperidinium spp. during or after C. furca red tides, and N. scintillans and Polykrikos spp. during or after C. polykrikoides red tides have been previously reported to occur in Korea, India, and Norway ( Jeong et al. 2000, Olseng et al. 2002, Biswas et al. 2013, Yoo et al. 2013a, National Fisheries Research & Development Institute 2014). Here, however, we report for the first time that Gyrodinium spp. are abundant during or after P. donghaiense red tides and that Protoperidinium spp. are abundant during or after A. fraterculus and/or C. polykrikoides red tides. Although Gyrodinium spp. and Protoperidinium spp. are known to feed on P. donghaiense and C. polykrikoides, respectively ( Cho 2006, Gu et al. 2014), no study of Protoperidinium spp. feeding on A. fraterculus has yet been published. It is worthwhile to explore feeding by Protoperidinium spp. on A. fraterculus because field data suggest the existence of potential predator-prey relationships between heterotrophic and phototrophic dinoflagellates. There was a 2-week time lag between the peak abundances of C. polykrikoides (Sep 1) and Polykrikos spp. (Sep 15). C. polykrikoides abundance was 3,000 cells mL −1 on Sep 1 and 335 cells mL −1 on Sep 15 ( Jeong et al. 2017), whereas that of Polykrikos spp. on the same dates was 2.5 and 78.8 cells mL −1, respectively. In a laboratory feeding experiment in which concentrations of C. polykrikoides were increased, P. kofoidii grew rapidly at mean prey concentrations ≤ ca. 300 cells mL −1 but became saturated at higher prey concentrations ( Kim 2004). Thus, theoretically, the abundance of C. polykrikoides from Sep 1 to 15 was likely to support positive growth of Polykrikos spp. The growth rate of Polykrikos spp. feeding on C. polykrikoides from Sep 1 to 15 was estimated to be 0.25 d −1, which is 23% of the maximum growth rate of P. kofoidii on C. polykrikoides obtained in the laboratory by Kim (2004). Many environmental factors, such as water temperature, turbulence, predators, and competition, may lower the growth rate. However, our results suggest that high C. polykrikoides abundance may result in increasing abundances of Polykrikos spp. during C. polykrikoides red tides.
Abundance of dominant heterotrophic protist groups
The maximum abundance of all HTDs observed during the study period was 82 cells mL −1, a level comparable to or higher than that measured in Sandsfjord (Norway), the Seto Inland Sea (Japan), Gyeonggi Bay (Korea), Chesapeake Bay (USA), Chile, and the Pearl River Estuary (Hong Kong, China) ( Table 7). The maximum chl- a concentration observed during the study period (44.2 μg L −1) was also comparable to or higher than those in other regions of the world ( Table 7). In general, the growth rate of HTDs rapidly increased with increasing concentrations of suitable algal prey species before becoming saturated (i.e., Lim et al. 2014b). Thus, high chl- a concentrations during red tides dominated by suitable prey species in this region may be partially responsible for the comparable or higher maximum abundance of total HTDs. However, the maximum abundance of total HTDs in this area was found to be considerably lower than in Masan Bay (Korea) and Albemarle-Pamlico Estuary (USA), as was the maximum concentration of chl- a ( Table 7). Thus, lower levels of chl- a during red tides may be partially responsible for the lower maximum abundance of total HTDs in the South Sea. Although maximum abundances differed substantially between the study area and Masan Bay and Albemarle-Pamlico Estuary, the differences between the maximum biomasses may be much smaller. The dominant HTDs in Masan Bay and Albemarle-Pamlico Estuary during periods of maximal HTD abundance were Pfiesteria and Pfiesteria-like dinoflagellates (PLDs, including species in the genera Luciella, Stoekeria, and Cryptoperidiniopsis) ( Glasgow et al. 2001, Yoo et al. 2013a), whereas the dominant HTDs in the study area were Polykrikos spp. The maximum biomass of Polykrikos spp. (3.6 ng C cell −1) in the study area was estimated to be 280 ng C mL −1, which is ~15% of the maximum biomass of HTDs in Masan Bay (1,916 ng C mL −1) ( Yoo et al. 2013a). The equivalent spherical diameter of Polykrikos spp. (ca. 44 μm) is much larger than that of PLDs (~13–14 μm) ( Jeong et al. 2010). Furthermore, the types of prey species that Polykrikos spp. feed on differ from those consumed by PLDs; engulfment-feeding Polykrikos spp. are known to consume large algal prey like the phototrophic dinoflagellates Lingulodinium polyedrum, Scrippsiella trochoidea, C. furca, C. polykrikoides, Gymnodinium catenatum, Gymnodinium impudicum, and Prorocentrum micans ( Jeong et al. 2001, Kim 2004), whereas peduncle-feeding PLDs prefer smaller algal prey such as the raphidophyte Heterosigma akashiwo, the cryptophytic Teleaulax sp., Rhodomonas salina, and Rhodomonas sp., and the phototrophic dinoflagellate Amphidinium carterae ( Jeong et al. 2005, 2006, 2007, Baek et al. 2010, Lim et al. 2014b). Therefore, the causative species of red tides in these waters may support different dominant HTDs, resulting in differences in maximum abundances. The maximum abundance of total TCs in the South Sea during the study period (49 cells mL −1) was higher than in the Seto Inland Sea (Japan), North Irish Sea (Ireland), Buzzards Bay, Long Island Sound, and Chesapeake Bay (USA), Sandsfjord (Norway), and the Gulf of Naples (Italy) ( Table 7). The maximum concentration of chl- a in the study area was also higher than in other regions of the world ( Table 7). On the other hand, the maximum abundance of total TCs in the study area was lower than in the Coastal North Sea and Masan Bay, and the maximum concentration of chl- a in the South Sea was also lower than in the Coastal North Sea and Masan Bay ( Table 7). Thus, higher or lower chl- a concentrations during or after red tides in the study area may be also partially responsible for the higher or lower maximum abundance of total TCs. The maximum abundance of total NCs (35 cells mL −1) was higher in the South Sea than in Long Island Sound and Chesapeake Bay (USA), Sandsfjord (Norway), and the Seto Inland Sea (Japan) ( Table 7), as was the maximum chl- a concentration ( Table 7). However, the maximum abundance of total NCs was considerably lower in the study region than in Masan Bay (Korea) ( Table 7). Moreover, the maximum concentration of chl- a and the maximum abundance of diatoms in the study area (44.2 μg L −1 and 13,020 cells mL −1, respectively) ( Jeong et al. 2017) were also much lower than in Masan Bay (514.7 μg L −1 and 71,538 cells mL −1, respectively) ( Jeong et al. 2013). According to Yoo et al. (2013a), total NC biomass was significantly positively correlated with diatom abundance in Masan Bay. Thus, the lower maximum abundance of diatoms in the study area may explain why the maximum abundance of total NCs was lower in the South Sea than in Masan Bay.
Grazing impacts by major heterotrophic protist groups on populations of red tide organisms
The maximum g by dominant heterotrophic protists on A. fraterculus, C. furca, C. polykrikoides, and P. donghaiense mostly exceeded 2.0 d−1 (i.e., ~87% of the population of a given red tide species was consumed in 1 d), but the mean g were <0.4 d−1 (i.e., ~33% of the population of a given red tide species was consumed in 1 d). Therefore, the dominant heterotrophic protists may at times have considerable grazing impacts on populations of these red tide species. The very high g (i.e., >5 d−1) may be caused by a combination of low red tide species abundance and high dominant heterotrophic protist abundance during the declining stages of red tides.
The maximum g attributable to dominant heterotrophic protists on co-occurring C. polykrikoides and C. furca estimated in this study were higher than those on the same prey species in other regions ( Table 8); for instance, the maximum g of P. kofoidii on C. polykrikoides in the present study (7.02 d −1) was higher than reported for Tongyeong and Masan Bay, Korea (1.21–2.64 d −1) ( Kim 2004, Yoo et al. 2013a). In addition, the maximum g for P. kofoidii on C. furca in the present study (4.13 d −1) was much higher than observed in Masan Bay (1.20 d −1) ( Yoo et al. 2013a). The abundances of P. kofoidii during C. polykrikoides and C. furca red tides in the study region were higher than those in Tongyeong and Masan Bay. Therefore, higher abundances of P. kofoidii during C. polykrikoides or C. furca red tides may be partially responsible for the higher maximum g’s of P. kofoidii on co-occurring C. polykrikoides and C. furca in the South Sea than in Tongyeong and Masan Bay. To the best of our knowledge, no studies have presented data on the grazing impacts of heterotrophic protists on P. donghaiense and A. fraterculus in other regions despite their having caused red tides in the waters of many countries ( Moncheva et al. 2001, MacKenzie et al. 2004, Tang et al. 2006, Omachi et al. 2007, Nagai et al. 2009, Hu et al. 2012, Park et al. 2013a). Thus, it is difficult to compare g’s by heterotrophic protists on P. donghaiense and A. fraterculus in the South Sea to those in other waters. The maximum g’s of G. dominans/ G. moestrupii, N. scintillans, and NCs (>100 μm) on P. donghaiense and A. fraterculus in our study were high, as mentioned above. Thus, it would be useful to explore the g’s of heterotrophic protists on P. donghaiense and A. fraterculus in other regions of the world. Overall, the dominant heterotrophic protist groups and their abundances in Korea’s South Sea varied considerably both spatially and temporally over the course of the study period; such variability was associated with changes in the dominant red tide species or groups. Furthermore, the maximum g’s of the dominant heterotrophic protists on the red tide species or groups were extremely high. Thus, red tide species, as prey, play important roles in the dynamics of the dominant heterotrophic protists, and in turn the dominant heterotrophic protists, as predators, play important roles in the dynamics of red tide organisms in marine ecosystems.
ACKNOWLEDGEMENTS
We thank Jae Seong Kim, Keon Kang Jang, Hak Bin Lee, Sang Beom Lee, Sang Pil Han, Seong Uk Kim, Young Seok Rho, Cheol Kang, and Choong Hyeon Choi for technical support. This research was supported by the National Research Foundation (NRF) funded by the Ministry of Science and ICT (NRF-2015M1A5A1041806) and Pilot project for predicting the outbreak of Cochlodinium polykrokoides red tides funded by MSI (NRF-2014M4A1H5009428) and the Useful Dinoflagellate Program of Korea Institute of Marine Science and Technology Promotion (KIMST) funded by the Ministry of Oceans and Fisheries (MOF) and Management of marine organisms causing ecological disturbance and harmful effect Program of KIMST and award to HJJ.
Fig. 1
Map of the study area (A & B) and sampling stations (black dots) (C) in the South Sea, Korea. (B) Section enlarged from map (A). (C) Section enlarged from map (B). The arrow in Goheung indicates Haechang Bay (HC Bay), the arrow between Goheung and Yeosu indicates Yeoja Bay (YJ Bay), and the arrow between Yeosu and Namhae indicates Seomjin River (SJ River). 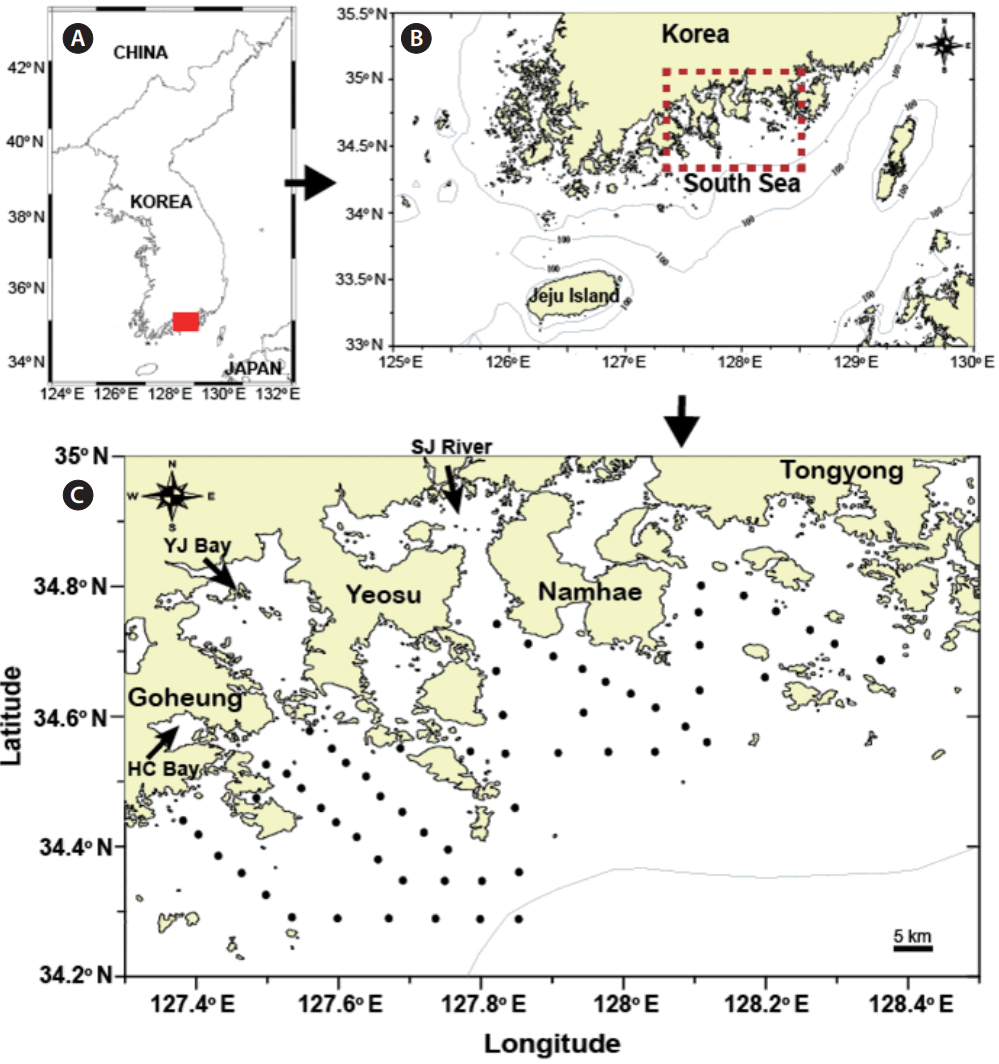
Fig. 2
Environmental factors and the abundances (cells mL−1) of heterotrophic protists in the South Sea of Korea from May 7 to Nov 11, 2014. (A) Average water temperature (T, °C). (B) Average salinity (S). (C) Maximum (MChl-a, mg m−3) and average (AChl-a, mg m−3) chl-a concentrations. (D) The period of red tides dominated by diatoms (Dia), Prorocentrum donghaiense (Pd), Ceratium furca (Cf), Alexandrium fraterculus (Af), and Cochlodinium polykrikoides (Cp). (E) Maximum (MTCs) and average (ATCs) abundances of total tintinnid ciliates. (F) Maximum (MNCs) and average (ANCs) abundances of total naked ciliates. (G) Maximum (MToCil) and average (AToCil) abundances of total ciliates. (H) Maximum (MHTDs) and average (AHTDs) abundances of total heterotrophic dinoflagellates. Open circles represent average ± standard error. 
Fig. 3
Three-dimensional distributions (cells mL−1) of tintinnid ciliates (TCs), naked ciliates (NCs), total ciliates (ToCil), and total heterotrophic dinoflagellates (HTDs) in the study area for each cruise from May 7 to Nov 11, 2014 drawn using Voxler software (Golden software, LLC, Golden, CO, USA). 
Fig. 4
The abundances (cells mL−1) of dominant heterotrophic dinoflagellates in the South Sea of Korea from May 7 to Nov 11, 2014. (A) The period of red tides dominated by diatoms (Dia), Prorocentrum donghaiense (Pd), Ceratium furca (Cf), Alexandrium fraterculus (Af), and Cochlodinium polykrikoides (Cp). (B) Maximum (MAGyr) and average (AAGyr) abundances of Gyrodinium spp. (C) Maximum (MAPro) and average (AAPro) abundances of Protoperidinium spp. (D) Maximum (MANoc) and average (AANoc) abundances of Noctiluca scintillans. (E) Maximum (MAPol) and average (AAPol) abundances of Polykrikos spp. Open circles represent average ± standard error. 
Fig. 5
Three-dimensional distributions (cells mL−1) of Gyrodinium spp., Polykrikos spp., Protoperidinium spp., and Noctiluca scintillans in the study area for each cruise from May 7 to Nov 11, 2014. 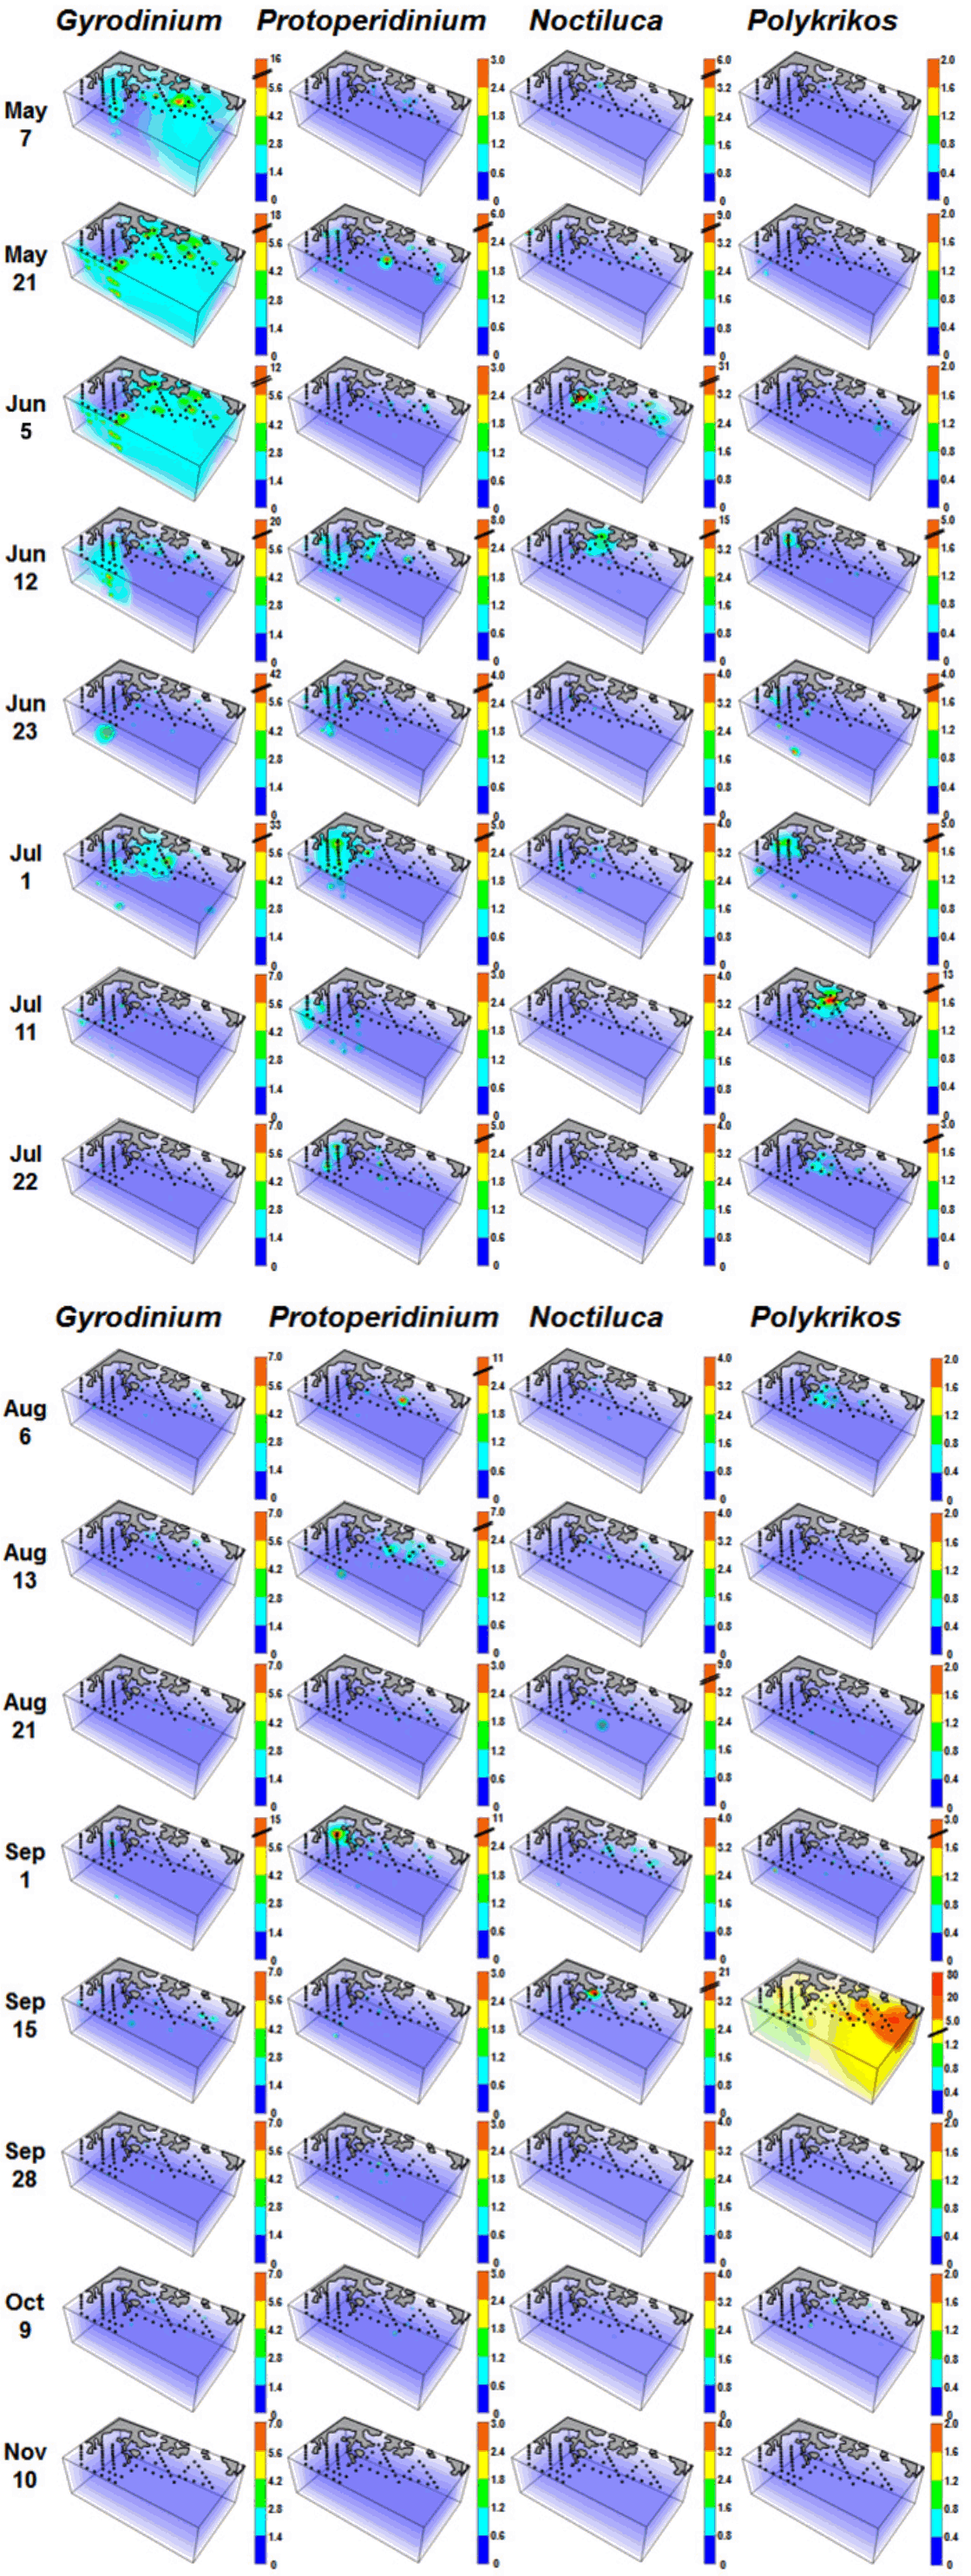
Fig. 6
Calculated grazing coefficients (g, d−1) attributable to the heterotrophic dinoflagellate Polykrikos kofoidii on co-occurring Cochlodinium polykrikoides, based on assumption (see text) in the study area at each cruise from May 7 to Nov 11, 2014. 
Fig. 7
Calculated grazing coefficients (g, d−1) attributable to the naked ciliates (>100 μm) on co-occurring Cochlodinium polykrikoides, based on assumption (see text) in the study area for each cruise from May 7 to Nov 11, 2014. 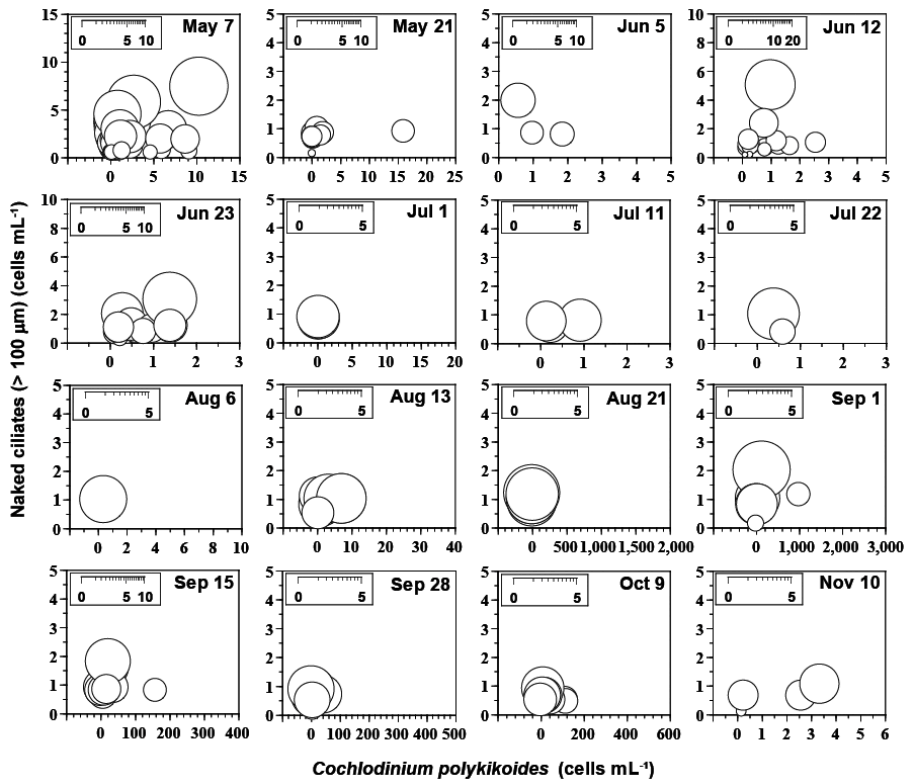
Appendix 1
Three-dimensional distributions of water temperature (T), salinity (S), chl- a (mg m −3), and heterotrophic protists (HTP, cells mL −1) in the study area for each cruise from May 7 to Nov 11, 2014. T, S, and chl- a were redrawn from Jeong et al. (2017). 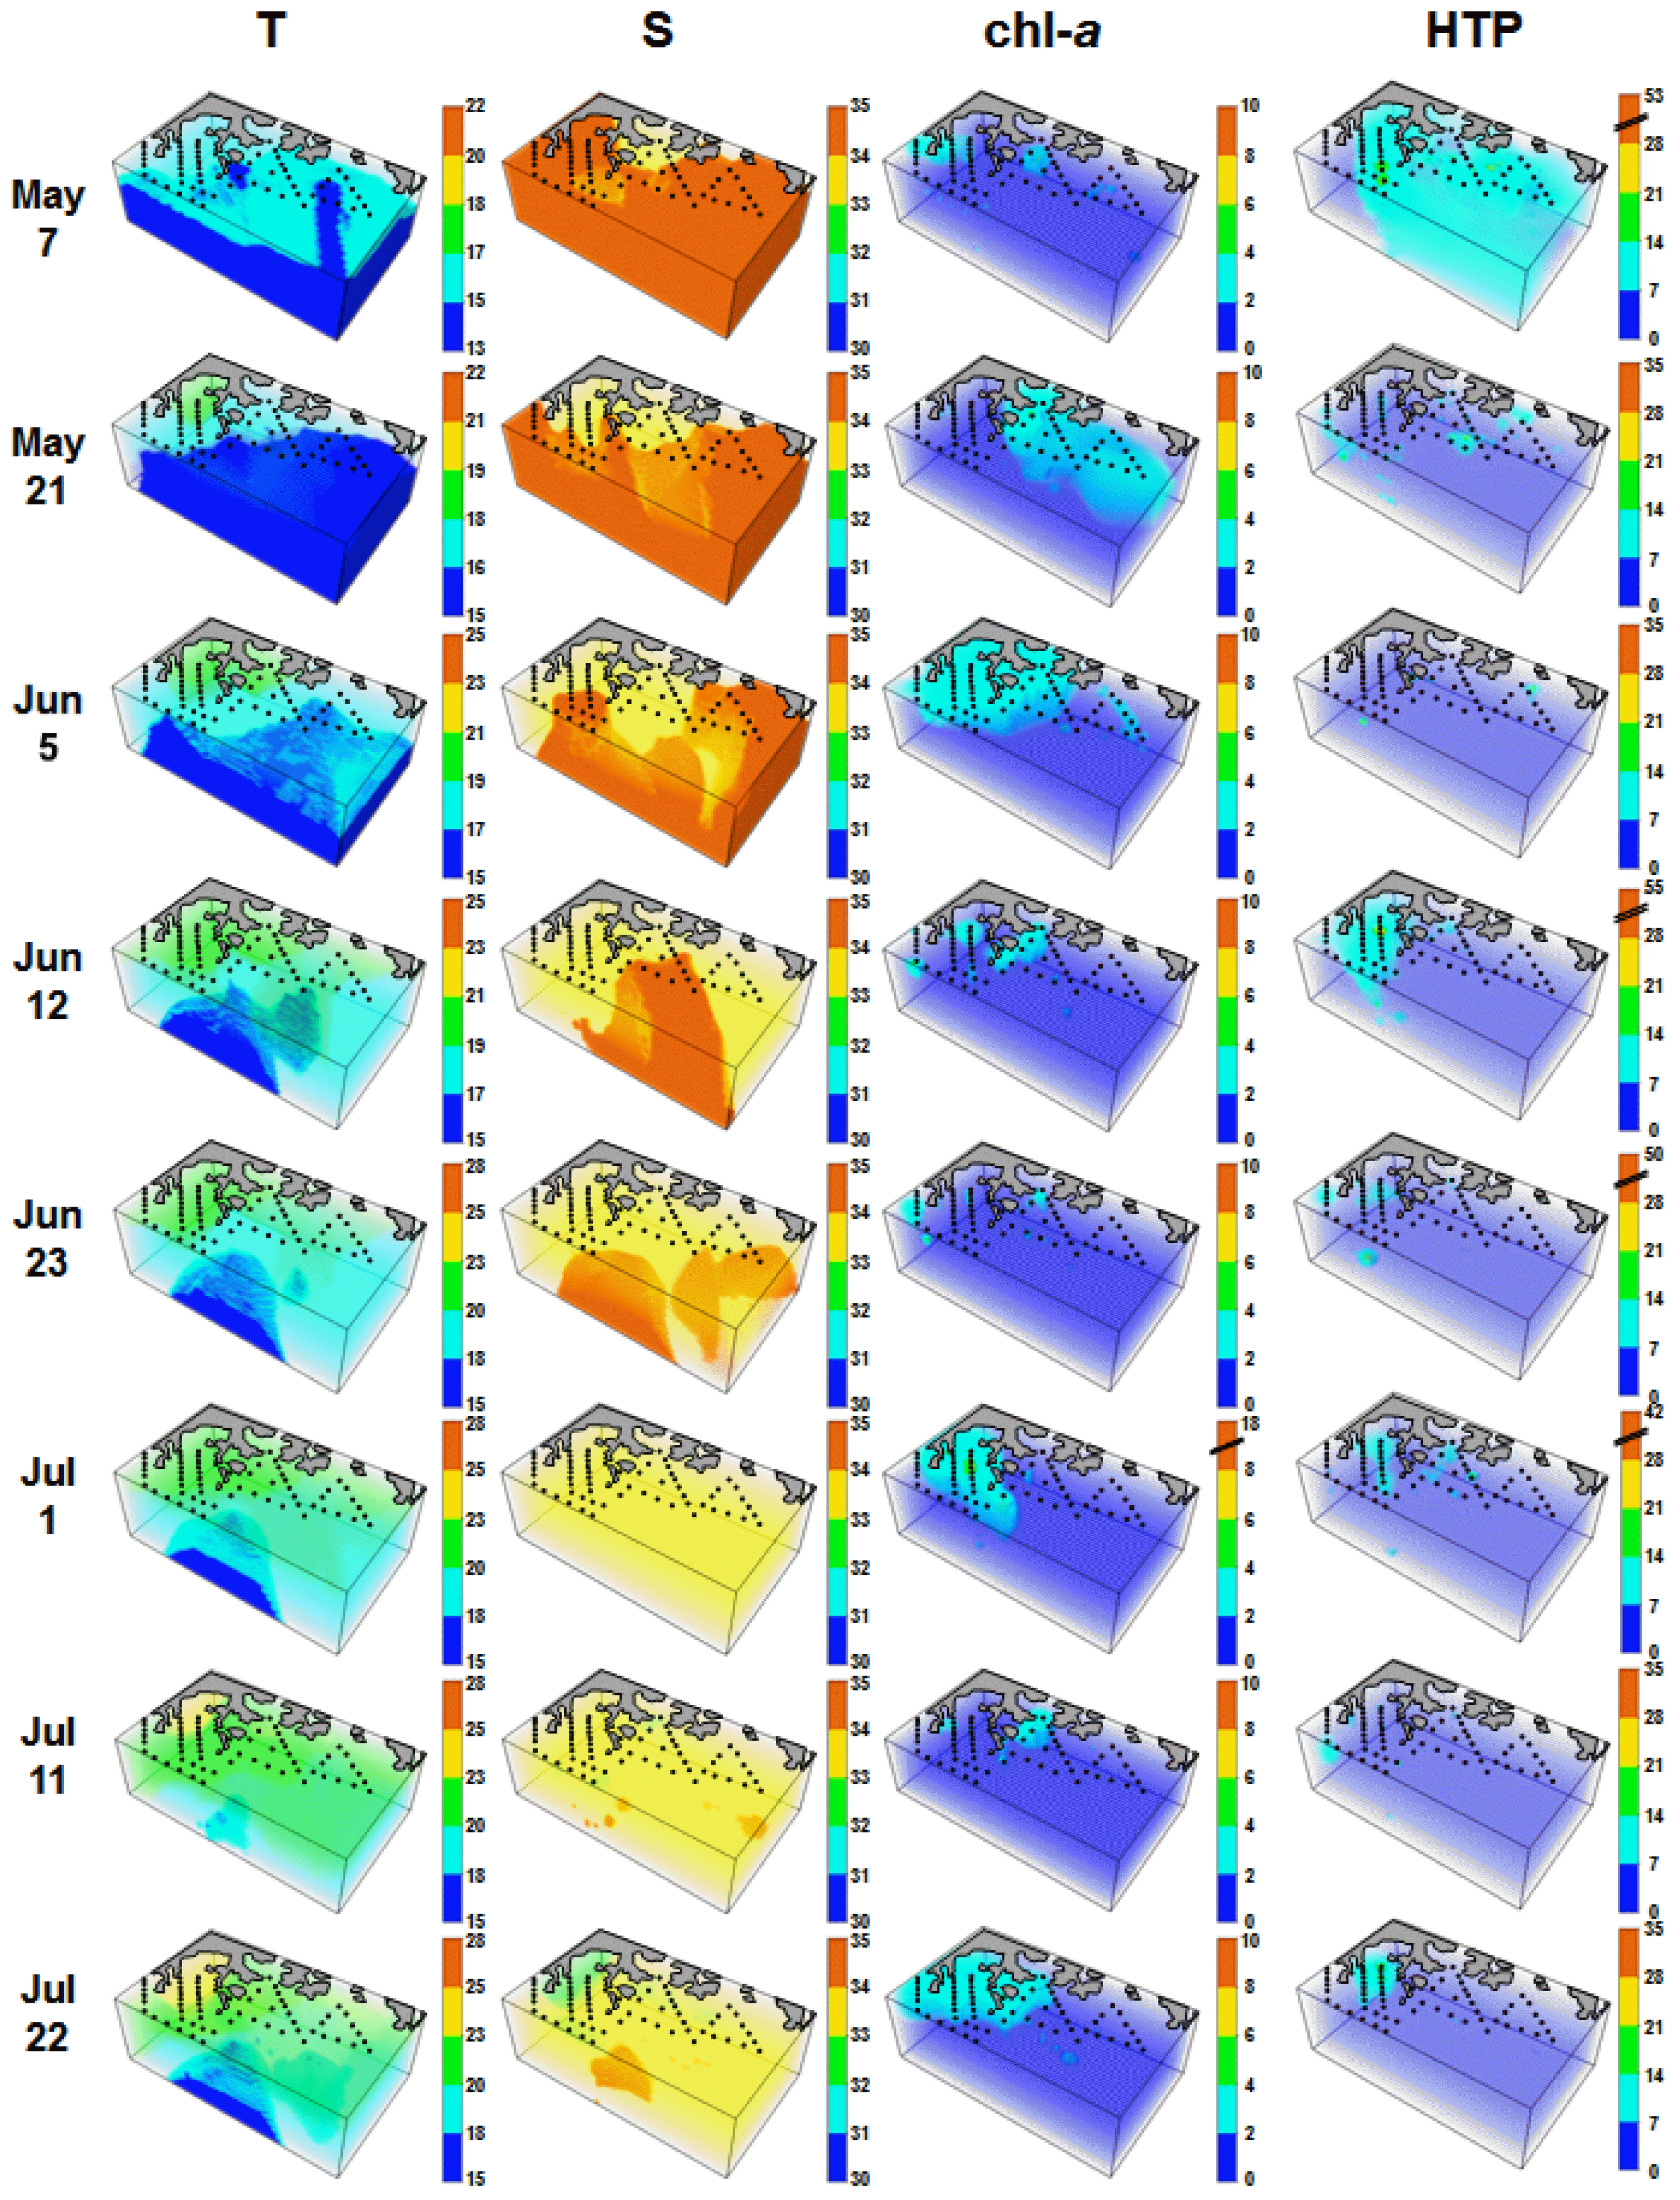 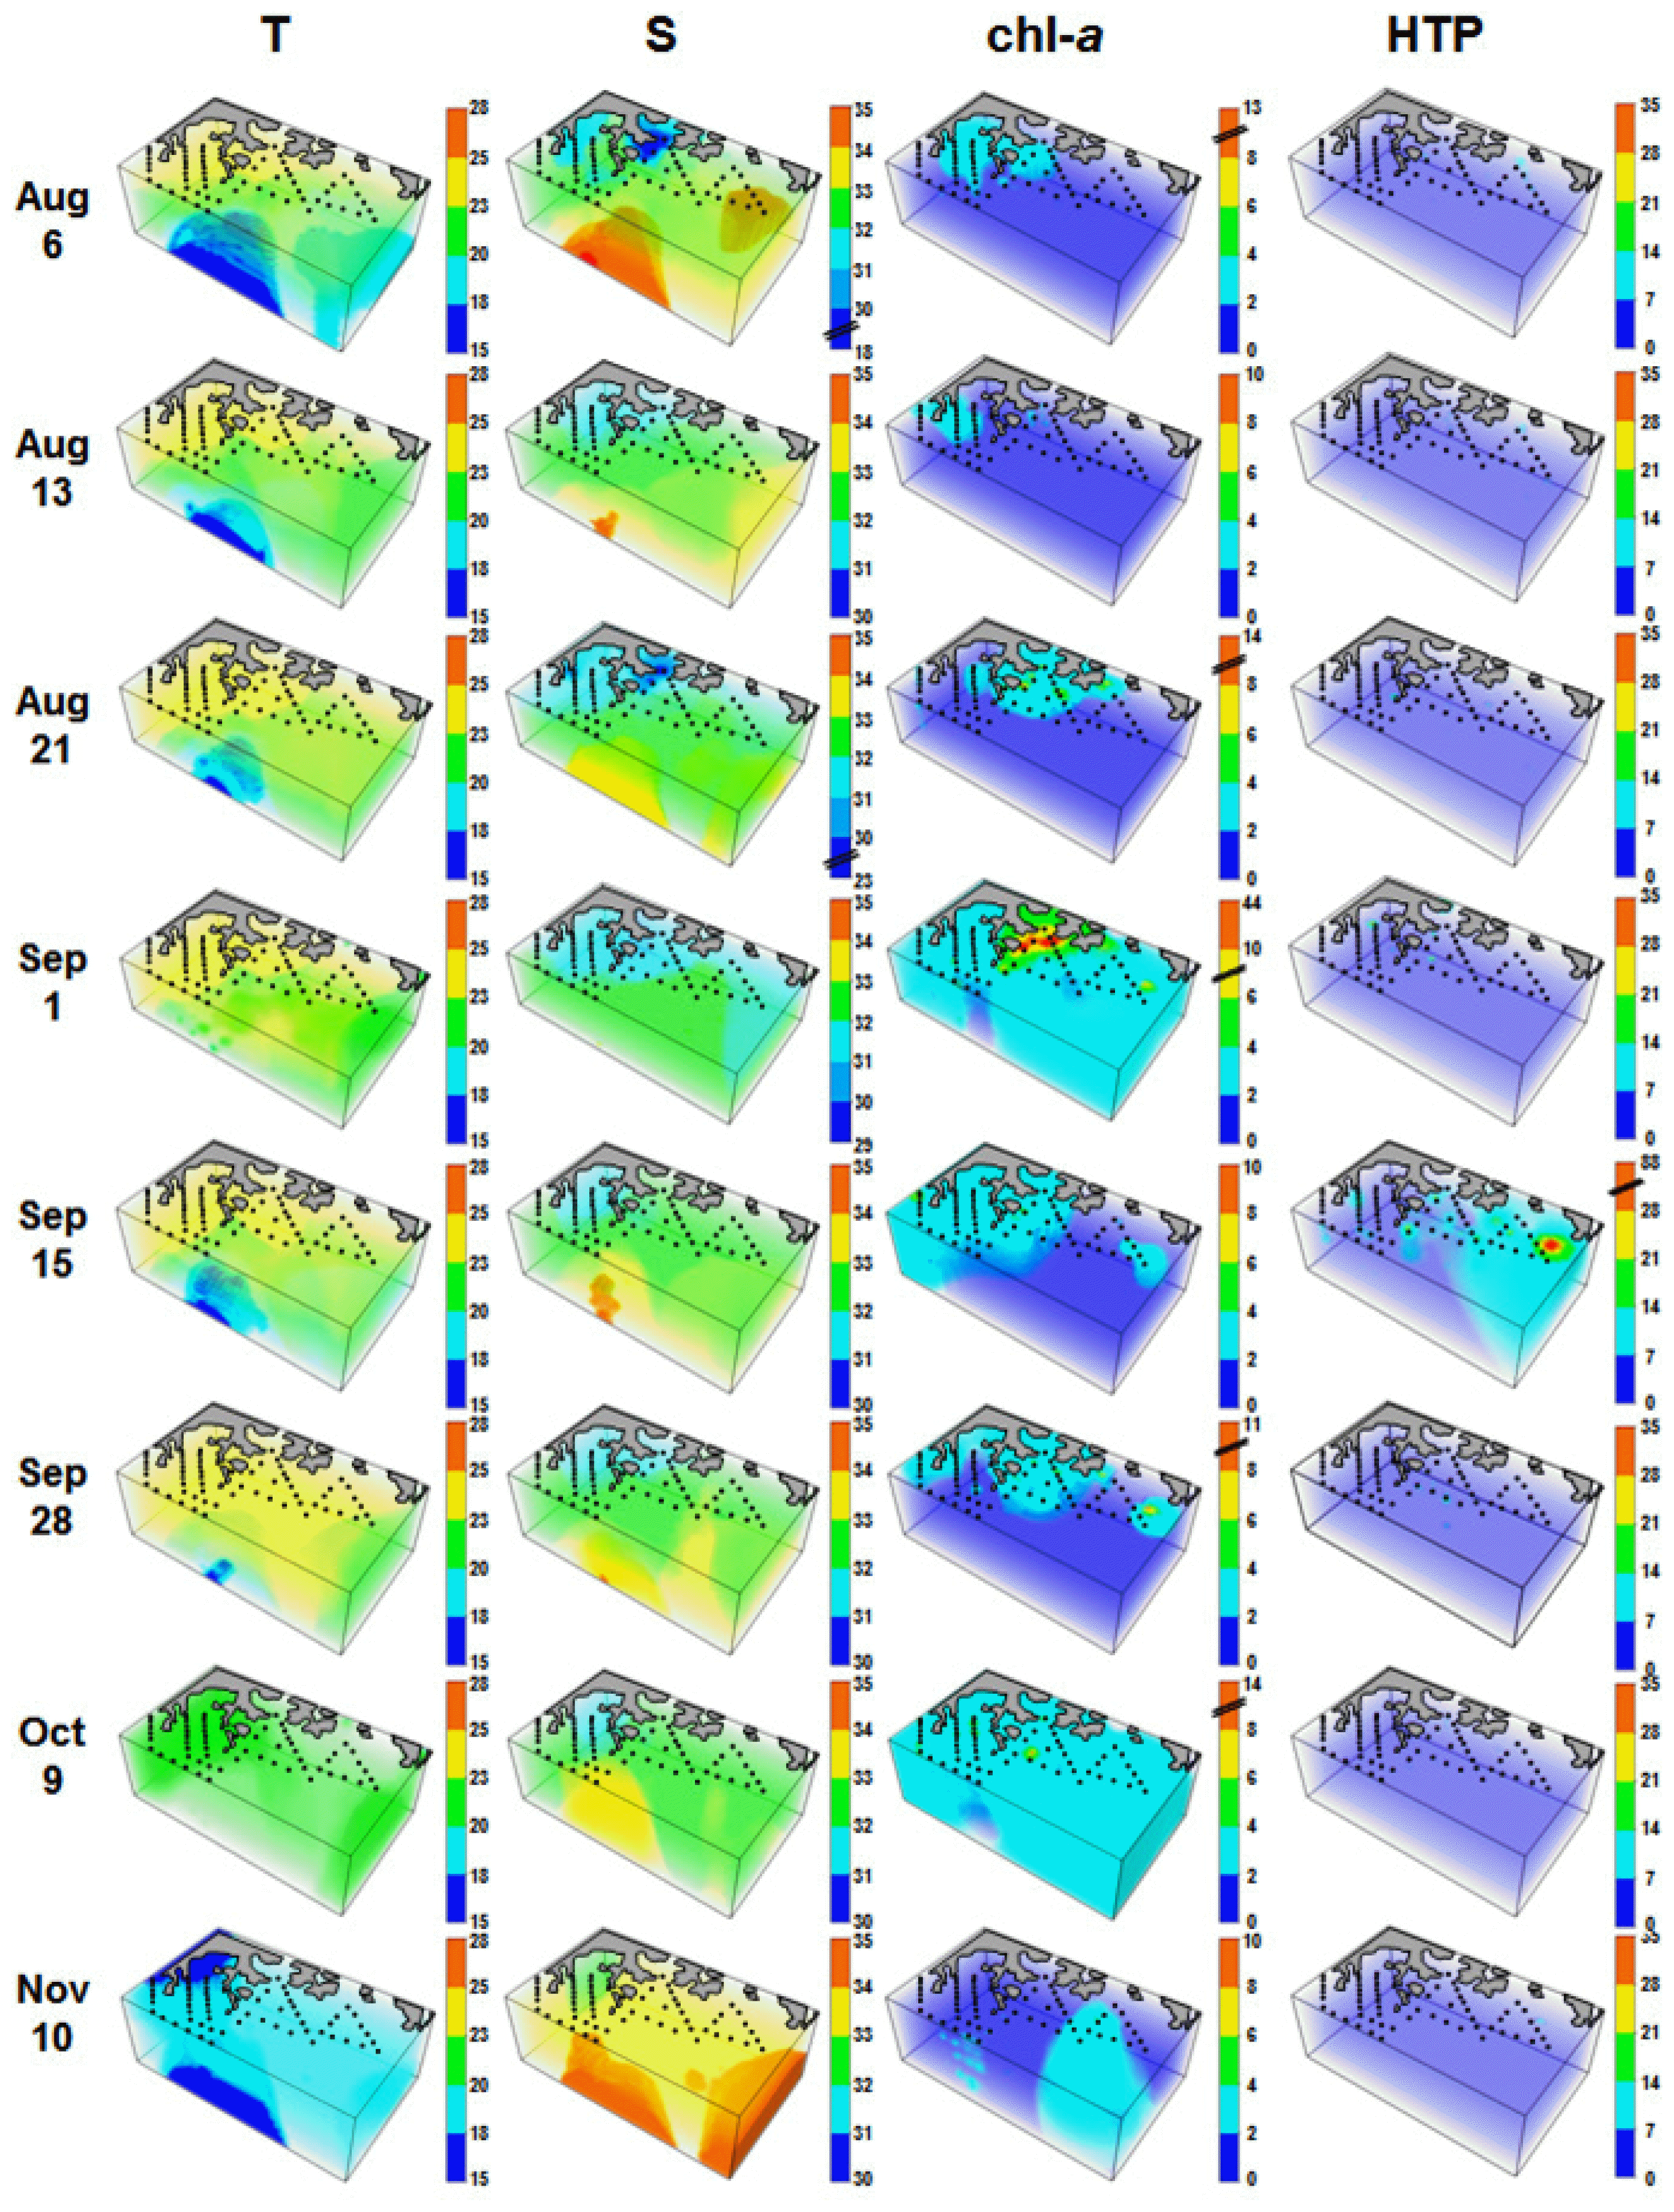
Table 1
Range of abundances for each group of heterotrophic protists and the major heterotorphic protist taxon, and the water temperature and salinity where each taxon was found in the South Sea of Korea from May to Nov 2014
|
Temperature (°C) |
Salinity |
Abundance (cells mL−1) |
|
Major group |
|
Total heterotrophic dinoflagellates |
13.6–26.6 |
23.5–35.8 |
0–82.4 |
|
Total tintinnid ciliates |
13.6–26.6 |
25.9–35.8 |
0–49.0 |
|
Total naked ciliates |
13.6–26.6 |
23.5–35.8 |
0–35.0 |
|
Total ciliates |
13.6–26.6 |
23.5–35.8 |
0–50.6 |
|
Total heterotrophic protists |
13.6–26.6 |
23.5–35.8 |
0–87.8 |
|
Major heterotrophic taxon |
|
Gyrodinium dominans/G. moestrupii
|
13.6–25.6 |
31.4–34.4 |
0–13.1 |
|
Polykrikos kofoidii
|
14.7–34.4 |
31.4–34.1 |
0–27.0 |
|
Polykrikos schwarzii
|
14.7–25.9 |
30.8–34.5 |
0–51.8 |
|
Noctiluca scintillans
|
13.9–26.6 |
23.5–34.3 |
0–30.7 |
|
Tintinnopsis sufflata
|
14.0–21.1 |
33.6–34.3 |
0–45.7 |
|
Tiarina fusus
|
13.6–24.1 |
31.4–34.5 |
0–20.0 |
Table 2
Correlations between the abundances (cells mL−1) of heterotrophic dinoflagellates (HTDs), tintinnid ciliates (TCs), naked ciliates (NCs), and the major HTDs and physical and biological properties, and the red tide species in the South Sea, Korea from May to Nov 2014
|
Organism |
T |
S |
Chl-a
|
PHY |
DIA |
PTD |
Pd |
Cf |
Af |
Cp |
|
TCs |
0.071**
|
- |
0.031*
|
0.047*
|
0.032*
|
0.045**
|
0.086**
|
0.042*
|
- |
- |
|
NCs |
−0.149**
|
0.089**
|
- |
0.072**
|
0.033*
|
0.087**
|
0.107**
|
- |
- |
- |
|
HTDs |
- |
- |
0.041**
|
0.115**
|
0.080**
|
0.104**
|
- |
- |
- |
- |
|
Gyrodinium spp. |
- |
- |
- |
- |
- |
- |
0.050**
|
- |
- |
- |
|
Protoperidinium spp. |
- |
- |
- |
- |
0.097**
|
- |
0.099**
|
- |
- |
- |
|
Noctiluca scintillans
|
- |
- |
- |
- |
0.127**
|
- |
0.046**
|
0.043**
|
- |
- |
|
Polykrikos spp. |
- |
- |
- |
- |
|
- |
- |
- |
- |
0.039*
|
Table 3
Calculated grazing coefficient (g, d−1) of the heterotrophic protists, Polykrikos kofoidii (Pk) and naked ciliates (NCs > 100 μm) on Cochlodinium polykrikoides (Cp) observed in the South Sea of Korea from May to Nov in 2014
|
Sampling date |
Abundance (cells mL−1) |
g |
Abundance (cells mL−1) |
g |
|
|
|
Cp |
Pk |
Cp |
NCs |
|
May 7–8 |
0.1–10.4 |
0.0 |
0.00 |
0.1–10.4 |
0.0–7.4 |
0.00–8.75 (1.35) |
|
May 21–22 |
0.1–24.3 |
0.0–0.6 |
0.00–0.13 (0.00) |
0.1–24.3 |
0.0–1.0 |
0.00–1.54 (0.21) |
|
Jun 5–6 |
0.1–4.1 |
0.0–0.8 |
0.00–0.22 (0.01) |
0.1–4.1 |
0.0–2.0 |
0.00–3.12 (0.17) |
|
Jun 12–13 |
0.1–5.0 |
0.0–0.8 |
0.00–0.24 (0.00) |
0.1–5.0 |
0.0–5.0 |
0.00–12.92 (0.60) |
|
Jun 23–24 |
0.1–1.4 |
0.0 |
0.00 |
0.1–1.4 |
0.0–3.0 |
0.00–7.46 (0.67) |
|
Jul 1–2 |
0.1–0.7 |
0.0–0.1 |
0.00–0.40 (0.01) |
0.1–0.7 |
0.0–0.9 |
0.00–2.35 (0.08) |
|
Jul 11–12 |
0.1–3.1 |
0.0–7.0 |
0.00–3.11 (0.05) |
0.1–3.1 |
0.0–0.8 |
0.00–2.33 (0.08) |
|
Jul 22–23 |
0.1–1.8 |
0.0–0.7 |
0.00–0.25 (0.01) |
0.1–1.8 |
0.0–1.0 |
0.00–3.45 (0.09) |
|
Aug 6–7 |
0.1–5.7 |
0.0–1.0 |
0.00–0.39 (0.01) |
0.1–5.7 |
0.0–1.0 |
0.00–2.88 (0.05) |
|
Aug 13–14 |
0.1–32.3 |
0.0 |
0.00 |
0.1–32.3 |
0.0–1.1 |
0.00–3.20 (0.21) |
|
Aug 21–22 |
0.1–1,767.0 |
0.0–0.7 |
0.00–0.32 (0.00) |
0.1–1,767.0 |
0.0–1.2 |
0.00–4.06 (0.20) |
|
Sep 1–2 |
0.2–2,989.3 |
0.0–1.6 |
0.00–0.40 (0.01) |
0.2–2,989.3 |
0.0–2.0 |
0.00–4.24 (0.05) |
|
Sep 15–16 |
0.1–334.9 |
0.0–27.0 |
0.00–7.02 (0.40) |
0.1–334.9 |
0.0–1.8 |
0.00–5.27 (0.14) |
|
Sep 28–29 |
0.1–438.0 |
0.0–1.0 |
0.00–0.37 (0.00) |
0.1–438.0 |
0.0–0.9 |
0.00–2.75 (0.08) |
|
Oct 9–10 |
0.1–521.3 |
0.0–0.8 |
0.00–0.28 (0.01) |
0.1–521.3 |
0.0–0.9 |
0.00–2.34 (0.05) |
|
Nov 10–11 |
0.1–6.0 |
0.0 |
0.00 |
0.1–6.0 |
0.0–1.1 |
0.00–2.03 (0.09) |
Table 4
Calculated grazing coefficient (g, d−1) of the heterotrophic protists, Gyrodinium dominans/G. moestrupii (Gd/Gm), Noctiluca scintillans (Ns), and naked ciliates (NCs > 100 μm) on Prorocentrum donghaiense (Pd) observed in the South Sea of Korea from May to Nov in 2014
|
Sampling date |
Abundance (cells mL−1) |
g |
Abundance of Ns (cells mL−1) |
g |
Abundance of NCs (cells mL−1) |
g |
|
|
Pd |
Gd/Gm |
|
May 7–8 |
0.3–117.0 |
0.0–13.8 |
0.00–0.33 (0.03) |
0.0–1.1 |
0.00–0.04 (0.01) |
0.0–7.2 |
0.00–13.12 (2.10) |
|
May 21–22 |
0.5–235.9 |
0.0–9.9 |
0.00–0.26 (0.02) |
0.0–4.6 |
0.00–0.23 (0.02) |
0.0–1.2 |
0.00–2.825 (0.24) |
|
Jun 5–6 |
0.2–233.6 |
0.0–10.1 |
0.00–0.28 (0.01) |
0.0–30.7 |
0.00–1.70 (0.03) |
0.0–2.0 |
0.00–3.941 (0.12) |
|
Jun 12–13 |
0.2–2,725.0 |
0.0–15.0 |
0.00–0.58 (0.02) |
0.0–15.0 |
0.00–0.95 (0.02) |
0.0–5.0 |
0.00–4.506 (0.35) |
|
Jun 23–24 |
0.1–948.8 |
0.0–3.1 |
0.00–0.10 (0.01) |
0.0–3.8 |
0.00–0.24 (0.01) |
0.0–2.0 |
0.00–7.456 (0.80) |
|
Jul 1–2 |
0.2–4,369.1 |
0.0–13.2 |
0.00–0.47 (0.03) |
0.0–4.4 |
0.00–0.27 (0.03) |
0.0–1.3 |
0.00–4.414 (0.19) |
|
Jul 11–12 |
0.5–463.6 |
0.0–4.5 |
0.00–0.21 (0.02) |
0.0–0.9 |
0.00–0.07 (0.01) |
0.0–0.9 |
0.00–3.858 (0.13) |
|
Jul 22–23 |
0.7–1.0 |
0.0–3.2 |
0.00–0.21 (0.06) |
0.0 |
0.00 |
0.0 |
0.00 |
|
Aug 6–7 |
0.8–2.1 |
0.0–1.0 |
0.00–0.06 (0.03) |
0.0–1.1 |
0.00–0.08 (0.02) |
0.0 |
0.00 |
|
Aug 13–14 |
- |
- |
- |
- |
- |
- |
- |
|
Aug 21–22 |
- |
- |
- |
- |
- |
- |
- |
|
Sep 1–2 |
- |
- |
- |
- |
- |
- |
- |
|
Sep 15–16 |
- |
- |
- |
- |
- |
- |
- |
|
Sep 28–29 |
1.0 |
0.0 |
0.00 |
0.0 |
0.00 |
0.0 |
0.00 |
|
Oct 9–10 |
0.4 |
0.0 |
0.00 |
0.0 |
0.00 |
0.0 |
0.00 |
|
Nov 10–11 |
0.5 |
0.0 |
0.00 |
0.0 |
0.00 |
0.0 |
0.00 |
Table 5
Calculated grazing coefficient (g, d−1) of the heterotrophic protist, Polykrikos kofoidii (Pk) on Ceratium furca (Cf) observed in the South Sea of Korea from May to Nov in 2014
|
Sampling date |
Abundance (cells mL−1) |
g |
|
|
Cf |
Pk |
|
May 7–8 |
0.1–1.0 |
0.0 |
0.00 |
|
May 21–22 |
0.1–1.5 |
0.0 |
0.00 |
|
Jun 5–6 |
0.2–4.0 |
0.0 |
0.00 |
|
Jun 12–13 |
0.5–9.9 |
0.0–0.8 |
0.00–0.13 (0.00) |
|
Jun 23–24 |
0.2–13.8 |
0.0 |
0.00 |
|
Jul 1–2 |
0.8–1.8 |
0.0 |
0.00 |
|
Jul 11–12 |
0.1–94.5 |
0.0–7.0 |
0.00–1.76 (0.02) |
|
Jul 22–23 |
0.3–131.2 |
0.0–2.1 |
0.00–0.56 (0.00) |
|
Aug 6–7 |
0.1–400.4 |
0.0–1.1 |
0.00–0.21 (0.00) |
|
Aug 13–14 |
0.1–100.0 |
0.0–1.0 |
0.00–0.23 (0.00) |
|
Aug 21–22 |
0.7–220.0 |
0.0–0.7 |
0.00–0.19 (0.00) |
|
Sep 1–2 |
0.7–11.7 |
0.0–1.0 |
0.00–0.25 (0.01) |
|
Sep 15–16 |
0.5–5.6 |
0.0–15.4 |
0.00–4.13 (0.27) |
|
Sep 28–29 |
0.1–3.0 |
0.0–0.5 |
0.00–0.12 (0.00) |
|
Oct 9–10 |
0.1–3.3 |
0.0–0.7 |
0.00–0.16 (0.01) |
|
Nov 10–11 |
0.1–3.0 |
0.0 |
0.00 |
Table 6
Calculated grazing coefficient (g, d−1) of the heterotrophic protist, Gyrodinium dominans/G. moestrupii (Gd/Gm) on Alexandrium fraterculus (Af) observed in the South Sea of Korea from May to Nov in 2014
|
Sampling date |
Abundance (cells mL−1) |
g |
|
|
Af |
Gd/Gm |
|
May 7–8 |
0.2–15.5 |
0.0–13.8 |
0.00–1.06 (0.12) |
|
May 21–22 |
0.1–20.4 |
0.0–10.9 |
0.00–1.10 (0.11) |
|
Jun 5–6 |
0.1–2.2 |
0.0–4.8 |
0.00–0.48 (0.05) |
|
Jun 12–13 |
0.5–17.5 |
0.0–15.0 |
0.00–2.00 (0.13) |
|
Jun 23–24 |
0.2–3.5 |
0.0–0.8 |
0.00–0.10 (0.02) |
|
Jul 1–2 |
0.7–3.8 |
0.0–10.9 |
0.00–1.49 (0.15) |
|
Jul 11–12 |
0.1–2.3 |
0.0–2.5 |
0.00–0.38 (0.05) |
|
Jul 22–23 |
0.5–1.0 |
0.0–1.0 |
0.00–0.19 (0.05) |
|
Aug 6–7 |
0.2–1.5 |
0.0–1.1 |
0.00–0.20 (0.02) |
|
Aug 13–14 |
0.1–9.5 |
0.0–3.0 |
0.00–0.57 (0.08) |
|
Aug 21–22 |
0.5–1,276.0 |
0.0–4.0 |
0.00–0.38 (0.02) |
|
Sep 1–2 |
0.2–49.5 |
0.0–15.0 |
0.00–1.34 (0.02) |
|
Sep 15–16 |
0.5–3.4 |
0.0–3.0 |
0.00–0.54 (0.03) |
|
Sep 28–29 |
0.5–8.9 |
0.0–2.0 |
0.00–0.35 (0.04) |
|
Oct 9–10 |
0.3–8.3 |
0.0–0.7 |
0.00–0.11 (0.01) |
|
Nov 10–11 |
0.1–12.0 |
0.0–0.7 |
0.00–0.07 (0.00) |
Table 7
Comparison of the abundances of total heterotrophic dinoflagellates (HTDs), tintinnid ciliates (TCs), and naked ciliates (NCs), and chl-a concentrations at each sampling site in estuarine and coastal regions
|
Study area |
Abundance (cell mL−1) |
Chl-a (μg L−1) |
Reference |
|
Total HTDs |
|
South Sea, Korea |
0–82 |
0.1–44.2 |
This study |
|
Sandsfjord system, Norway |
7.5–19 |
~6 |
Nielsen and Andersen (2002)
|
|
Seto Inland, Japan |
4–90 |
~8 |
Nakamura et al. (1995)
|
|
Gyenggi Bay, Korea |
0.4–95 |
1.0–66.4 |
Yang et al. (2008)
|
|
Chesapeake Bay, USA |
0–99 |
4.8–24.1 |
Johnson et al. (2003)
|
|
Coast of Chile, Chile |
59–104 |
~3 |
Claustre et al. (2008), Masquelier and Vaulot (2008)
|
|
Pearl River Estuary, China Sea |
10–142 |
>1.0 |
Lan et al. (2009)
|
|
Masan Bay, Korea |
1–10,289 |
0.02–514.7 |
Yoo et al. (2013a)
|
|
Albemarle-Pamlico Estuary, USA |
300–1,200,000 |
10–112 |
Glasgow et al. (2001)
|
|
Total TCs |
|
South Sea, Koea |
0–49 |
0.1–44.2 |
This study |
|
Seto Inland Sea, Japan |
<0.1–0.2 |
~8 |
Nakamura et al. (1995)
|
|
North Irish Sea, Ireland |
0–1.5 |
~12 |
Graziano (1989)
|
|
Buzzards Bay, USA |
0–3.3 |
- |
Pierce and Turner (1994)
|
|
Sandsfjord system, Norway |
0.7–5.5 |
~6 |
Nielsen and Anderson (2002)
|
|
Seto Inland Sea, Japan |
0.02–5.7 |
0.4–8.0 |
Kamiyama and Tsujino (1996)
|
|
Long Island Sound, USA |
0.3–12.6 |
- |
Capriulo and Carpenter (1983)
|
|
Chesapeake Bay, USA |
0–13 |
4.8–24.1 |
Johnson et al. (2003)
|
|
Gulf of Naples, Italy |
0–30.5 |
0.1–7.5 |
Modigh and Castaldo (2002)
|
|
Coastal North Sea, Netherlands |
118a
|
50a
|
Admiraal and Venekamp (1986), Admiraal et al. (1985)
|
|
Narragansett Bay, Rhode Island |
270a
|
20a
|
Verity (1987)
|
|
Masan Bay, Korea |
1–216 |
0.02–514.7 |
Yoo et al. (2013a)
|
|
Flødevigen Bay, Norway |
729a
|
0.5–4.6 |
Dale and Dahl (1987)
|
|
Total NCs |
|
South Sea, Korea |
0–35 |
0.1–44.2 |
This study |
|
Long Island Sound, USA |
0.02–6.4 |
- |
Capriulo and Carpenter (1983)
|
|
Sandsfjord system, Norway |
5–18 |
~6 |
Nielsen and Andersen (2002)
|
|
Seto Inland Sea, Japan |
2–22 |
~8 |
Nakamura et al. (1995)
|
|
Chesapeake Bay, USA |
1.7–22 |
4.8–24.1 |
Johnson et al. (2003)
|
|
Masan Bay, Korea |
1–1,113 |
0.02–514.7 |
Yoo et al. (2013a)
|
Table 8
Comparison of the measured or calculated grazing coefficient (g, d−1) of heterotrophic protists on each red-tide organism
|
Red-tide organism |
Predator |
Area |
g (d−1) |
Reference |
|
Ceratium furca
|
Polykrikos kofoidii
|
South Sea, Korea |
0.00–4.13 |
This study |
|
Polykrikos kofoidii
|
Masan Bay, Korea |
0.24–1.20 |
Yoo et al. (2013a)
|
|
Cochlodinium polykrikoides
|
Polykrikos kofoidii
|
South Sea, Korea |
0.00–7.02 |
This study |
|
Ciliates (>100 μm) |
South Sea, Korea |
0.00–12.92 |
This study |
|
Polykrikos kofoidii
|
Masan Bay, Korea |
0.07–2.64 |
Yoo et al. (2013a)
|
|
Polykrikos kofoidii
|
Tongyeong, Korea |
0.01–1.21 |
Kim (2004)
|
|
Strombidinopsis sp. |
Tongyeong, Korea |
0.01–0.79 |
Kim (2004)
|
Appendix 2
List of heterotrophic protists and their presence/absence on each sampling date in the South Sea, Korea, from May to Nov 2014
|
May 7 |
May 21 |
Jun 5 |
Jun 12 |
Jun 23 |
Jul 1 |
Jul 11 |
Jul 22 |
Aug 6 |
Aug 13 |
Aug 21 |
Sep 1 |
Sep 15 |
Sep 28 |
Oct 9 |
Nov 10 |
|
Heterotrophic dinoflagellate
|
|
Amphidiniopsis kofoidii
|
+ |
+ |
|
|
|
|
|
|
|
|
|
|
|
|
|
|
|
Gyrodinium dominans/G. moestrupii (<40 μm) |
+ |
+ |
+ |
+ |
+ |
+ |
+ |
+ |
+ |
+ |
+ |
+ |
+ |
+ |
+ |
+ |
|
Gyrodinium spirale
|
|
|
|
|
+ |
|
|
|
|
|
|
|
+ |
|
|
|
|
Gyrodinium sp. A (41–60 μm) |
+ |
+ |
+ |
+ |
+ |
+ |
+ |
+ |
+ |
+ |
+ |
+ |
+ |
+ |
+ |
+ |
|
Gyrodinium sp. B (61–69 μm) |
+ |
+ |
+ |
+ |
+ |
+ |
+ |
+ |
+ |
+ |
+ |
+ |
+ |
+ |
+ |
+ |
|
Gyrodinium sp. C (70–89 μm) |
+ |
+ |
+ |
+ |
+ |
+ |
+ |
+ |
+ |
+ |
+ |
+ |
+ |
+ |
+ |
|
|
Gyrodinium sp. D (90–99 μm) |
|
|
|
+ |
|
|
|
|
|
|
|
|
|
|
|
|
|
Gyrodinium sp. E (>100 μm) |
+ |
+ |
+ |
+ |
+ |
+ |
+ |
+ |
+ |
+ |
|
|
|
+ |
+ |
+ |
|
Katodinium glaucum
|
+ |
+ |
|
+ |
+ |
|
+ |
|
|
+ |
|
+ |
|
|
+ |
|
|
Nematodinium spp. |
+ |
+ |
+ |
+ |
+ |
+ |
+ |
+ |
+ |
+ |
|
|
+ |
+ |
+ |
|
|
Noctiluca scintillans
|
+ |
+ |
+ |
+ |
+ |
+ |
+ |
+ |
+ |
+ |
+ |
+ |
+ |
+ |
+ |
+ |
|
Oxyphysis oxytoxoides
|
|
|
|
|
|
|
+ |
|
|
|
+ |
|
|
|
|
|
|
Podolampas palmipes
|
+ |
|
|
|
|
|
|
|
+ |
+ |
|
|
|
+ |
+ |
+ |
|
Polykrikos kofoidii
|
|
+ |
+ |
+ |
+ |
+ |
+ |
+ |
+ |
+ |
+ |
+ |
+ |
+ |
+ |
|
|
Polykrikos schwarzii
|
+ |
+ |
+ |
+ |
+ |
+ |
+ |
+ |
+ |
+ |
+ |
+ |
+ |
+ |
+ |
+ |
|
Protoperidinium bipes
|
+ |
+ |
+ |
+ |
|
+ |
+ |
+ |
|
+ |
|
|
|
|
|
|
|
Protoperidinium brevipes
|
+ |
+ |
+ |
+ |
+ |
+ |
+ |
+ |
+ |
+ |
|
|
|
|
|
+ |
|
Protoperidinium crassipes
|
|
|
|
|
|
|
+ |
|
+ |
|
+ |
|
|
|
+ |
|
|
Protoperidinium cruciferum
|
+ |
+ |
+ |
+ |
+ |
+ |
+ |
+ |
+ |
+ |
+ |
+ |
+ |
+ |
+ |
+ |
|
Protoperidinium depressum
|
+ |
+ |
|
+ |
+ |
+ |
+ |
+ |
+ |
+ |
+ |
+ |
+ |
+ |
+ |
|
|
Protoperidinium divergens
|
|
|
|
|
+ |
|
+ |
+ |
+ |
+ |
+ |
+ |
+ |
|
+ |
+ |
|
Protoperidinium excentricum
|
+ |
|
+ |
|
|
|
|
|
|
|
|
|
|
|
|
|
|
Protoperidinium hirobis
|
+ |
+ |
|
|
+ |
+ |
+ |
|
|
+ |
|
|
|
|
+ |
|
|
Protoperidinium leonis
|
+ |
+ |
+ |
|
|
|
|
|
|
+ |
|
+ |
|
|
|
|
|
Protoperidinium oceanicum
|
+ |
+ |
+ |
+ |
|
+ |
|
+ |
|
+ |
+ |
+ |
+ |
+ |
+ |
|
|
Protoperidinium pallidum
|
|
+ |
+ |
+ |
+ |
+ |
|
+ |
+ |
|
+ |
|
|
|
+ |
+ |
|
Protoperidinium pentagonum
|
+ |
+ |
+ |
+ |
+ |
+ |
+ |
+ |
+ |
+ |
+ |
+ |
+ |
|
+ |
+ |
|
Protoperidinium pyriforme
|
+ |
+ |
+ |
+ |
+ |
+ |
+ |
+ |
+ |
+ |
|
+ |
+ |
+ |
+ |
|
|
Protoperidinium subinerme
|
|
+ |
|
+ |
|
+ |
+ |
|
+ |
|
|
|
|
+ |
|
+ |
|
Protoperidinium sp. |
+ |
+ |
+ |
+ |
+ |
+ |
+ |
+ |
+ |
+ |
+ |
+ |
+ |
+ |
+ |
+ |
|
Tintinnid ciliate
|
|
Amphorellopsis acuta
|
+ |
|
|
|
|
|
|
+ |
|
+ |
+ |
+ |
|
+ |
+ |
|
|
Codonellopsis frigida
|
|
|
|
|
|
|
|
|
|
|
|
+ |
+ |
|
|
|
|
Codonellopsis nipponica
|
+ |
+ |
|
|
|
|
|
+ |
|
|
+ |
+ |
+ |
+ |
+ |
+ |
|
Codonellopsis sp. |
|
|
|
|
|
|
|
|
|
+ |
+ |
+ |
+ |
|
|
|
|
Dadayiella ganymedes
|
|
|
|
+ |
+ |
+ |
+ |
+ |
+ |
+ |
+ |
+ |
+ |
+ |
+ |
+ |
|
Eutintinnus lusus-undae
|
+ |
|
|
|
|
|
|
|
|
|
|
|
|
|
|
|
|
Eutintinnus sp. |
|
+ |
+ |
+ |
+ |
+ |
+ |
+ |
+ |
+ |
+ |
+ |
+ |
+ |
+ |
+ |
|
Favella ehrenbergii
|
+ |
|
+ |
+ |
|
+ |
+ |
|
+ |
+ |
+ |
+ |
+ |
+ |
+ |
|
|
Favella sp. |
+ |
+ |
+ |
|
|
+ |
+ |
+ |
+ |
+ |
+ |
+ |
+ |
+ |
+ |
|
|
Helicostomella longa
|
+ |
|
+ |
+ |
+ |
+ |
+ |
+ |
+ |
+ |
|
+ |
+ |
|
|
+ |
|
Helicostomella subulata
|
|
|
|
|
|
|
|
|
|
|
|
|
+ |
|
|
|
|
Leprotintinnus bottnicus
|
|
+ |
+ |
+ |
+ |
+ |
+ |
+ |
+ |
+ |
+ |
+ |
+ |
+ |
+ |
+ |
|
Leprotintinnus nordquisti
|
+ |
|
+ |
+ |
+ |
+ |
+ |
+ |
+ |
|
+ |
|
+ |
|
|
+ |
|
Leprotintinnus pellucides
|
|
|
|
|
|
|
|
|
|
|
|
|
+ |
|
|
|
|
Steestrupiella steenstrupii
|
|
|
|
|
|
|
+ |
|
|
|
|
|
|
|
|
|
|
Stenosemella nivalis
|
|
+ |
+ |
+ |
+ |
+ |
+ |
+ |
+ |
+ |
+ |
+ |
+ |
+ |
+ |
+ |
|
Stenosemella sp. |
+ |
|
|
|
|
|
|
|
|
|
|
|
|
|
|
|
|
Tintinnidium mucicola
|
|
+ |
+ |
+ |
+ |
+ |
+ |
+ |
+ |
+ |
|
|
+ |
+ |
+ |
+ |
|
Tintinnopsis akkeshiensis
|
+ |
|
+ |
+ |
+ |
+ |
+ |
+ |
+ |
+ |
+ |
+ |
|
+ |
+ |
+ |
|
Tintinnopsis angustior
|
+ |
|
|
|
|
|
|
|
|
|
|
|
|
|
|
|
|
Tintinnopsis beroidea
|
+ |
+ |
|
|
|
|
|
|
+ |
|
|
|
|
|
|
|
|
Tintinnopsis brevicollis
|
|
+ |
+ |
|
|
|
|
|
+ |
+ |
|
|
|
+ |
+ |
|
|
Tintinnopsis directa
|
+ |
|
|
|
|
+ |
|
+ |
+ |
|
|
|
+ |
|
+ |
|
|
Tintinnopsis gracilis
|
|
+ |
+ |
+ |
+ |
+ |
+ |
+ |
+ |
+ |
+ |
+ |
+ |
+ |
+ |
+ |
|
Tintinnopsis kofoidii
|
+ |
|
+ |
+ |
+ |
+ |
+ |
+ |
+ |
+ |
+ |
+ |
+ |
|
+ |
+ |
|
Tintinnopsis lohmanni
|
+ |
+ |
|
|
|
+ |
|
|
|
|
|
|
|
+ |
|
|
|
Tintinnopsis mortensenii
|
|
|
+ |
+ |
|
+ |
+ |
+ |
+ |
+ |
+ |
+ |
+ |
+ |
+ |
|
|
Tintinnopsis nana
|
+ |
+ |
|
+ |
+ |
+ |
|
+ |
+ |
+ |
|
|
+ |
|
+ |
+ |
|
Tintinnopsis radix
|
|
|
|
+ |
+ |
+ |
+ |
+ |
+ |
+ |
+ |
+ |
+ |
+ |
|
+ |
|
Tintinnopsis rapa
|
+ |
|
+ |
|
|
|
|
+ |
+ |
|
|
|
|
|
+ |
|
|
Tintinnopsis sufflata
|
+ |
|
|
|
|
+ |
|
|
|
|
|
|
|
|
|
|
|
Tintinnopsis tubulosa
|
|
+ |
+ |
+ |
+ |
+ |
+ |
+ |
+ |
+ |
+ |
|
+ |
+ |
+ |
+ |
|
Tintinnopsis tubulosoides
|
+ |
+ |
+ |
+ |
+ |
+ |
+ |
+ |
+ |
+ |
+ |
+ |
+ |
+ |
+ |
+ |
|
Tintinnopsis sp. |
|
+ |
+ |
+ |
+ |
+ |
+ |
+ |
+ |
+ |
+ |
+ |
+ |
+ |
+ |
+ |
|
Undella sp. |
+ |
|
+ |
+ |
+ |
+ |
+ |
+ |
+ |
+ |
+ |
+ |
+ |
+ |
|
+ |
|
Naked ciliate
|
|
Didinium sp. |
|
|
|
|
|
+ |
+ |
+ |
+ |
+ |
|
|
|
|
|
|
|
Tiarina fusus
|
+ |
+ |
+ |
+ |
+ |
+ |
+ |
+ |
+ |
+ |
+ |
|
+ |
+ |
+ |
+ |
|
Ciliate (≤50 μm) |
+ |
+ |
+ |
+ |
+ |
+ |
+ |
+ |
+ |
+ |
+ |
+ |
+ |
+ |
+ |
+ |
|
Ciliate (51–99 μm) |
+ |
+ |
+ |
+ |
+ |
+ |
+ |
+ |
+ |
+ |
+ |
+ |
+ |
+ |
+ |
+ |
|
Ciliate (>100 μm) |
+ |
+ |
+ |
+ |
+ |
+ |
+ |
+ |
+ |
+ |
+ |
+ |
+ |
+ |
+ |
+ |
REFERENCES
Admiraal, W., Beukema, J. & van Es, FB. 1985. Seasonal fluctuations in the biomass and metabolic activity of bacterioplankton and phytoplankton in a well-mixed estuary: the Ems-Dollard (Wadden Sea). J Plankton Res. 7:877–890.   Admiraal, W. & Venekamp, LAH. 1986. Significance of tintinnid grazing during blooms of Phaeocystis pouchetii (Haptophyceae) in Dutch coastal waters. Neth J Sea Res. 20:61–66. Anderson, DM. 1995. ECOHAB: the ecology and oceanography of harmful algal blooms: a national research agenda. Woods Hole Oceanographic Institute, Woods Hole, MA, 66 pp.
Anderson, DM., Alpermann, TJ., Cembella, AD., Collos, Y., Masseret, E. & Montresor, M. 2012. The globally distributed genus Alexandrium: multifaceted roles in marine ecosystems and impacts on human health. Harmful Algae. 14:10–35.   Baek, SH., You, K., Katano, T. & Shin, K. 2010. Effects of temperature, salinity, and prey organisms on the growth of three Pfiesteria-like heterotrophic dinoflagellates. Plankton Benthos Res. 5:31–38. Biswas, SN., Godhantaraman, N., Rakashit, D. & Sarkar, SK. 2013. Community composition, abundance, biomass and production rates of Tintinnids (Ciliate: Protozoa) in the coastal regions of Sundarban Mangrove wetland, India. Indian J Geo-Mar Sci. 42:163–173.
Cai, Q., Li, R., Zhen, Y., Mi, T. & Yu, Z. 2006. Detection of two Prorocentrum species using sandwich hybridization integrated with nuclease protection assay. Harmful Algae. 5:300–309. Calbet, A., Vaqué, D., Felipe, J., Vila, M., Sala, MM., Alcaraz, M. & Estrada, M. 2003. Relative grazing impact of microzooplankton and mesozooplankton on a bloom of the toxic dinoflagellate Alexandrium minutum. Mar Ecol Prog Ser. 259:303–309. Capriulo, GM. & Carpenter, EJ. 1983. Abundance, species composition and feeding impact of tintinnid micro-zooplankton in central Long Island Sound. Mar Ecol Prog Ser. 10:277–288. Cho, E-S. 2006. Report on Protoperidinium sp. fed on Cochlodinium polykrikoides (Gymnodiniales, Dinophyceae). J Environ Sci. 15:385–386.
Claustre, H., Sciandra, A. & Vaulot, D. 2008. Introduction to the special section bio-optical and biogeochemical conditions in the South East Pacific in late 2004: the BIOSOPE program. Biogeosci Discussions. 5:605–640. Dale, T. & Dahl, E. 1987. Mass occurrence of planktonic oligotrichous ciliates in a bay in southern Norway. J Plankton Res. 9:871–879. Eaton, AD., Clesceri, LS., Greenberg, AE. & Franson, MAH. 1995. Standard methods for the examination of water and wastewater. 19th ed. American Public Health Association (APHA), Washington, DC, 43 pp.
Eppley, RW. & Harrison, WG. 1975. Physiological ecology of Gonyaulax polyedrum, a red tide water dinoflagellate of southern California. In : In : Locicero VR, editor In: Proc 1st Int Conf Toxic Dinoflagellate Blooms; Massachusetts Science and Technology Foundation, Wakefield, MA. 11–22.
Franks, PJS. & Anderson, DM. 1992. Alongshore transport of a toxic phytoplankton bloom in a buoyancy current: Alexandrium tamarense in the Gulf of Maine. Mar Biol. 112:153–164. Fu, FX., Tatters, AO. & Hutchins, DA. 2012. Global change and the future of harmful algal blooms in the ocean. Mar Ecol Prog Ser. 470:207–233. Fukuyo, Y., Imai, I., Kodama, M. & Tamai, K. 2002. Red tides and other harmful algal blooms in Japan. In : Tayler FJR, Trainer VL, editors Harmful Algal Blooms in the PICES Region of the North Pacific. PICES Sci. Rep No. 23. North Pacific Marine Science Organization (PICES) Institute of Ocean Sciences, Sidney, BC, 7–20.
Glasgow, HB., Burkholder, JM., Mallin, MA., Deamer-Melia, NJ. & Reed, RE. 2001. Field ecology of toxic Pfiesteria complex species and a conservative analysis of their role in estuarine fish kills. Environ Health Perspect. 109(Suppl 5):715–730. Glibert, PM., Anderson, DM., Gentein, P., Granéli, E. & Sellner, KG. 2005. The global, complex phenomena of harmful algal blooms. Oceanography. 18:136–147. Gobler, CJ., Berry, DL., Anderson, OR., Burson, A., Koch, F., Rodgers, BS., Moore, LK., Goleski, JA., Allam, B., Bowser, P., Tang, Y. & Nuzzi, R. 2008. Characterization, dynamics, and ecological impacts of harmful Cochlodinium polykrikoides blooms on eastern Long Island, NY, USA. Harmful Algae. 7:293–307. Graziano, C. 1989. On the ecology of tintinnids (Ciliophora: Oligotrichida) in the North Irish Sea. Estuar Coast Shelf Sci. 29:233–245. Gu, H., Luo, Z., Lin, L. & Gao, Y. 2014. First report of Gyrodinium fusiforme and G. moestrupii (Dinophyceae) in China Sea waters. Biodivers Sci. 22:401–406. Hansen, PJ. 1991. Quantitative importance and trophic role of heterotrophic dinoflagellates in a coastal pelagial food web. Mar Ecol Prog Ser. 73:253–261. Hansen, PJ., Bjørnsen, PK. & Hansen, BW. 1997. Zooplankton grazing and growth: scaling within the 2–2000-μm body size range. Limnol Oceanogr. 42:687–704. Holmes, RW., Williams, PM. & Eppley, RW. 1967. Red water in La Jolla Bay, 1964–1966. Limnol Oceanogr. 12:503–512. Hong, H-H., Lee, H-G., Jo, J., Kim, HM., Kim, S-M., Park, JY., Jeon, CB., Kang, H-S., Park, MG., Park, C. & Kim, KY. 2016. The exceptionally large genome of the harmful red tide dinoflagellate Cochlodinium polykrikoides Margalef (Dinophyceae): determination by flow cytometry. Algae. 31:373–378. Horner, RA., Garrison, DL. & Plumley, FG. 1997. Harmful algal blooms and red tide problems on the U.S. west coast. Limnol Oceanogr. 42(5 Pt 2):1076–1088. Hu, Z., Mulholland, MR., Duan, S. & Xu, N. 2012. Effects of nitrogen supply and its composition on the growth of Prorocentrum donghaiense. Harmful Algae. 13:72–82. Imai, I., Yamaguchi, M. & Hori, Y. 2006. Eutrophication and occurrences of harmful algal blooms in the Seto Inland Sea, Japan. Plankton Benthos Res. 1:71–84. Jang, SH., Jeong, HJ., Lim, AS., Kwon, JE. & Kang, NS. 2016. Feeding by the newly described heterotrophic dinoflagellate Aduncodinium glandula: having the most diverse prey species in the family Pfiesteriaceae. Algae. 31:17–31. Jeong, HJ., Ha, JH., Park, JY., Kim, JH., Kang, NS., Kim, S., Kim, JS., Yoo, YD. & Yih, WH. 2006. Distribution of the heterotrophic dinoflagellate Pfiesteria piscicida in Korean waters and its consumption of mixotrophic dinoflagellates, raphidophytes and fish blood cells. Aquat Microb Ecol. 44:263–278. Jeong, HJ., Ha, JH., Yoo, YD., Park, JY., Kim, JH., Kang, NS., Kim, TH., Kim, HS. & Yih, WH. 2007. Feeding by the Pfiesteria-like heterotrophic dinoflagellate Luciella masanensis. J Eukaryotic Microbiol. 54:231–241. Jeong, HJ., Kim, JS., Kim, JH., Kim, ST., Seong, KA., Kim, TH., Song, JY. & Kim, SK. 2005. Feeding and grazing impact of the newly described heterotrophic dinoflagellate Stoeckeria algicida on the harmful alga Heterosigma akashiwo. Mar Ecol Prog Ser. 295:69–78. Jeong, HJ., Kim, JS., Yoo, YD., Kim, ST., Song, JY., Kim, TH., Seong, KA., Kang, NS., Kim, MS., Kim, JH., Kim, S., Ryu, J., Lee, HM. & Yih, WH. 2008. Control of the harmful alga Cochlodinium polykrikoides by the naked ciliate Strombidinopsis jeokjo in mesocosm enclosures. Harmful Algae. 7:368–377. Jeong, HJ., Kim, SK., Kim, JS., Kim, ST., Yoo, YD. & Yoon, JY. 2001. Growth and grazing rates of the heterotrophic dinoflagellate Polykrikos kofoidii on red-tide and toxic dinoflagellates. J Eukaryot Microbiol. 48:298–308. Jeong, HJ., Lim, AS., Franks, PJS., Lee, KH., Kim, JH., Kang, NS., Lee, MJ., Jang, SH., Lee, SY., Yoon, EY., Park, JY., Yoo, YD., Seong, KA., Kwon, JE. & Jang, TY. 2015. A hierarchy of conceptual models of red-tide generation: nutrition, behavior, and biological interactions. Harmful Algae. 47:97–115. Jeong, HJ., Lim, AS., Lee, K., Lee, MJ., Seong, KA., Kang, NS., Jang, SH., Lee, KH., Lee, SY., Kim, MO., Kim, JH., Kwon, JE., Kang, HC., Kim, JS., Yih, W., Shin, K., Jang, PK., Ryu, J-H., Kim, SY., Park, JY. & Kim, KY. 2017. Ichthyotoxic Cochlodinium polykrikoides red tides offshore in the South Sea, Korea in 2014: I. Temporal variations in three-dimensional distributions of red-tide organisms and environmental factors. Algae. 32:101–130. Jeong, HJ., Park, JK., Kim, JS., Kim, ST., Yoon, JE., Kim, SK. & Park, YM. 2000. The outbreak of red tides in the coastal waters off Kohung, Chonnam, Korea. 3. The temporal and spatial variations in the heterotrophic dinoflagellates and ciliates in 1997. J Korean Soc Oceangr. 5:37–46.
Jeong, HJ., Shim, JH., Lee, CW., Kim, JS. & Koh, SM. 1999. Growth and grazing rates of the marine planktonic ciliate Strombidinopsis sp. on red-tide and toxic dinoflagellates. J Eukaryot Microbiol. 46:69–76. Jeong, HJ., Yoo, YD., Kim, JS., Seong, KA., Kang, NS. & Kim, TH. 2010. Growth, feeding and ecological roles of the mixotrophic and heterotrophic dinoflagellates in marine planktonic food webs. Ocean Sci J. 45:65–91. Jeong, HJ., Yoo, YD., Lee, KH., Kim, TH., Seong, KA., Kang, NS., Lee, SY., Kim, JS., Kim, S. & Yih, WH. 2013. Red tides in Masan Bay, Korea in 2004–2005: I. daily variations in the abundance of red-tide organisms and environmental factors. Harmful Algae. 30(Suppl 1):S75–S88. Johnson, MD., Rome, M. & Stoecker, DK. 2003. Microzooplankton grazing on Prorocentrum minimum and Karlodinium micrum in Chesapeake Bay. Limnol Oceanogr. 48:238–248. Kamiyama, T. & Tsujino, M. 1996. Seasonal variation in the species composition of tintinnid ciliates in Hiroshima Bay, the Seto Inland Sea of Japan. J Plankton Res. 18:2313–2327. Kim, JS. 2004. Grazing impact of protozooplankton on red tide organisms in the southern and western coastal waters of Korea. Ph D dissertation. Kunsan National University, Gunsan, Korea, 238 pp.
Kim, JS. & Jeong, HJ. 2004. Feeding by the heterotrophic dinoflagellates Gyrodinium dominans and G. spirale on the red-tide dinoflagellate Prorocentrum minimum. Mar Ecol Prog Ser. 280:85–94. Kudela, RM. & Gobler, CJ. 2012. Harmful dinoflagellate blooms caused by Cochlodinium sp.: global expansion and ecological strategies facilitating bloom formation. Harmful Algae. 14:71–86. Lan, W., Huang, B., Dai, M., Ning, X., Huang, L. & Hong, H. 2009. Dynamics of heterotrophic dinoflagellates off the Pearl River Estuary, northern South China Sea. Estuar Coast Shelf Sci. 85:422–430. Lee, MJ., Jeong, HJ., Lee, KH., Jang, SH., Kim, JH. & Kim, KY. 2015. Mixotrophy in nematocyst-taeniocyst complex-bearing phototrophic dinoflagellate Polykrikos hartmarnii. Harmful Algae. 49:124–134. Lessard, EJ. 1991. The trophic role of heterotrophic dinoflagellates in diverse marine environments. Mar Microb Food Webs. 5:49–58.
Lim, AS., Jeong, HJ., Jang, TY., Jang, SH. & Franks, PJS. 2014a. Inhibition of growth rate and swimming speed of the harmful dinoflagellate Cochlodinium polykrikoides by diatoms: implications for red tide formation. Harmful Algae. 37:53–61. Lim, AS., Jeong, HJ., Jang, TY., Yoo, YD., Kang, NS., Yoon, EY. & Kim, GH. 2014b. Feeding by the newly described heterotrophic dinoflagellate Stoeckeria changwonensis: a comparison with other species in the family Pfiesteriaceae. Harmful Algae. 36:11–21. Lim, AS., Jeong, HJ., Kim, JH., Jang, SH., Lee, MJ. & Lee, K. 2015. Mixotrophy in the newly described dinoflagellate Alexandrium pohangense: a specialist for feeding on the fast-swimming ichthyotoxic dinoflagellate Cochlodinium polykrikoides. Harmful Algae. 49:10–18. Lim, AS., Jeong, HJ., Kim, JH. & Lee, SY. 2017. Control of ichthyotoxic Cochlodinium polykrikoides using the mixotrophic dinoflagellate Alexandrium pohangense: a potential effective sustainable method. Harmful Algae. 63:109–118. MacKenzie, L., de Salas, M., Adamson, J. & Beuzenberg, V. 2004. The dinoflagellate genus Alexandrium (Halim) in New Zealand coastal waters: comparative morphology, toxicity and molecular genetics. Harmful Algae. 3:71–92. Masquelier, S. & Vaulot, D. 2008. Distribution of micro-organisms along a transect in the South-East Pacific Ocean (BIOSOPE cruise) using epifluorescence microscopy. Biogeosciences. 5:311–321. Modigh, M. & Castaldo, S. 2002. Variability and persistence in tintinnid assemblages at a Mediterranean coastal site. Aquat Microb Ecol. 28:299–311. Moncheva, S., Gotsis-Skretas, O., Pagou, K. & Krastev, A. 2001. Phytoplankton blooms in Black Sea and Mediterranean coastal ecosystems subjected to anthropogenic eutrophication: similarities and differences. Estuar Coast Shelf Sci. 53:281–295. Montagnes, DJS. & Lessard, EJ. 1999. Population dynamics of the marine planktonic ciliate Strombidinopsis multiauris: its potential to control phytoplankton blooms. Aquat Microb Ecol. 20:167–181. Mulholland, MR., Morse, RE., Boneillo, GE., Bernhardt, PW., Filippino, KC., Procise, LA., Blanco-Garcia, JL., Marshall, HG., Egerton, TA., Hunley, WS., Moore, KA., Berry, DL. & Gobler, CJ. 2009. Understanding causes and impacts of the dinoflagellate, Cochlodinium polykrikoides, blooms in the Chesapeake Bay. Estuar Coast. 32:734–747. Nagai, S., Nishitani, G., Takano, Y., Yoshida, M. & Takayama, H. 2009. Encystment and excystment under laboratory conditions of the nontoxic dinoflagellate Alexandrium fraterculus (Dinophyceae) isolated from the Seto Inland Sea, Japan. Phycologia. 48:177–185. Nakamura, Y., Suzuki, S. & Hiromi, J. 1995. Population dynamics of heterotrophic dinoflagellates during a Gymnodinium mikimotoi red tide in the Seto Inland Sea. Mar Ecol Prog Ser. 125:269–277. National Fisheries Research & Development Institute (NFRDI). 2014. Harmful Algal Blooms in Korean Coastal Waters in 2013. NFRDI, Busan, 114–130.
Nielsen, T. & Andersen, C. 2002. Plankton community structure and production along a freshwater-influenced Norwegian fjord system. Mar Biol. 141:707–724. Olseng, CD., Naustvoll, L-J. & Paasche, E. 2002. Grazing by the heterotrophic dinoflagellate Protoperidinium steinii on a Ceratium bloom. Mar Ecol Prog Ser. 225:161–167. Omachi, CY., Tamanaha, MS. & Proença, LAO. 2007. Bloom of Alexandrium fraterculus in coastal waters off Itajaí, SC, Southern Brazil. Braz J Oceanogr. 55:57–61. Park, J., Jeong, HJ., Yoo, YD. & Yoon, EY. 2013a. Mixotrophic dinoflagellate red tides in Korean waters: distribution and ecophysiology. Harmful Algae. 30(Suppl 1):S28–S40. Park, TG., Lim, WA., Park, YT., Lee, CK. & Jeong, HJ. 2013b. Economic impact, management and mitigation of red tides in Korea. Harmful Algae. 30(Suppl 1):S131–S143. Pierce, RW. & Turner, JT. 1994. Plankton studies in Buzzards Bay, Massachusetts, USA. IV. Tintinnids, 1987 to 1988. Mar Ecol Prog Ser. 112:235–240. Seong, KA., Jeong, HJ., Kim, S., Kim, GH. & Kang, JH. 2006. Bacterivory by co-occurring red-tide algae, heterotrophic nanoflagellates, and ciliates. Mar Ecol Prog Ser. 322:85–97. Sherr, EB. & Sherr, BF. 2007. Heterotrophic dinoflagellates: a significant component of microzooplankton biomass and major grazers of diatoms in the sea. Mar Ecol Prog Ser. 352:187–197. Smayda, TJ. 1990. Novel and nuisance phytoplankton blooms in the sea: evidence for a global epidemic. In : Granéli E, Sundström B, Edler L, Anderson DM, editors Toxic Marine Phytoplankton. Elsevier Publishers B.V., Amsterdam, 29–40.
Sordo, I., Barton, ED., Cotos, JM. & Pazos, Y. 2001. An inshore poleward current in the NW of the Iberian Peninsula detected from satellite images, and its relation with G. catenatum and D. acuminata blooms in the Galican Rias. Estuar Coast Shelf Sci. 53:787–799. Tang, D., Di, B., Wei, G., Ni, I-H., Oh, IS. & Wang, S. 2006. Spatial, seasonal and species variations of harmful algal blooms in the South Yellow Sea and East China Sea. Hydrobiologia. 568:245–253. Turner, JT. 2006. Harmful algae interactions with marine planktonic grazers. In : Granéli E, Turner JT, editors Ecology of Harmful Algae. Springer, Berlin-Heidelberg, 259–270. Verity, PG. 1987. Abundance, community composition, size distribution, and production rates of tintinnids in Narragansett Bay, Rhode Island. Estuar Coast Shelf Sci. 24:671–690. Welch, PS. 1948. Limnological methods. Blakiston Co., Philadelphia, PA, 381 pp.
Whyte, JNC., Haigh, N., Ginther, NG. & Keddy, LJ. 2001. First record of blooms of Cochlodinium sp. (Gymnodiniales, Dinophyceae) causing mortality to aquacultured salmon on the west coast of Canada. Phycologia. 40:298–304. Yang, EJ., Choi, JK. & Hyun, J-H. 2008. Seasonal variation in the community and size structure of nano- and microzooplankton in Gyeonggi Bay, Yellow Sea. Estuar Coast Shelf Sci. 77:320–330. Yoo, YD., Jeong, HJ., Kim, JS., Kim, TH., Kim, JH., Seong, KA., Lee, SH., Kang, NS., Park, JW., Park, J., Yoon, EY. & Yih, WH. 2013a. Red tides in Masan Bay, Korea in 2004–2005: II. Daily variations in the abundance of heterotrophic protists and their grazing impact on red-tide organisms. Harmful Algae. 30(Suppl 1):S89–S101. Yoo, YD., Yoon, EY., Jeong, HJ., Lee, KH., Hwang, YJ., Seong, KA., Kim, JS. & Park, JY. 2013b. The newly described heterotrophic dinoflagellate Gyrodinium moestrupii, an effective protistan grazer of toxic dinoflagellates. J Eukaryot Microbiol. 60:13–24. Zhang, S., Liu, H., Chen, B. & Wu, C-J. 2015. Effects of diet nutritional quality on the growth and grazing of Noctiluca scintillans. Mar Ecol Prog Ser. 527:73–85.
|
|