INTRODUCTION
Large, infrequent disturbances (LIDs) such as earthquakes, fires, floods and hurricanes can play important roles in altering landscape patterns in ecosystem structure (e.g., Carleton and MacLellan 1994, Connell et al. 1997, Carpenter 1998, Turner and Dale 1998). However, because these phenomena are generally unpredictable and occur over large geographic areas, assessing their impacts over several degrees of latitude can be difficult using data from single short-term studies. Rather, they are often studied post hoc using information obtained from one or more long-term ecosystem monitoring programs that encompass the necessary time periods and geographic ranges (Carpenter 1998, Turner and Dale 1998). Such programs can be especially informative if they include information on both the species of interest and the forcing factors associated with the large-scale disturbances. Unfortunately, these programs often have their own life spans due to funding constraints, career longevities, and logistical issues, which can limit their full usefulness. Consequently, support for their continuation is needed if we are to better prepare for understanding future events.
One of the most important large-scale disturbances to impact coastal marine ecosystems worldwide is the El Niño-Southern Oscillation (hereafter ENSO). ENSOs are large-scale climatic anomalies that originate in the tropical Pacific Ocean, but impact oceanographic and climatic conditions globally (Barber and Chavez 1983, Wooster and Fluharty 1985, Glynn 1988). In the eastern Pacific Ocean, they are generally characterized by anomalously warm, nutrient-poor water and intense winter storm activity (Wooster and Fluharty 1985). These factors can have devastating impacts to coastal marine communities, especially subtidal kelp forests (Dayton and Tegner 1984, 1990, Tegner and Dayton 1987, Tegner et al. 1997, Hernández-Carmona et al. 2001, Edwards 2004, Edwards and Estes 2006), though the severity of these impacts undoubtedly varies as a function of the strength of each ENSO. A commonly used estimate of their relative strength is the Multivariate ENSO Index (hereafter MEI), which is determined from the unrotated first principle components of six oceanographic and atmospheric variables measured over the tropical Pacific Ocean (Wolter and Timlin 1998). Specifically, the MEI is derived from the tropical Pacific Comprehensive Ocean-Atmosphere Data Set (COADS) and includes measurements of sea level pressure, surface and meridional winds, sea surface temperature (SST), surface air temperature, and cloudiness. While the MEI can be a good metric by which to make general comparisons at a global scale, the associated atmospheric and oceanographic factors that impact many coastal ecosystems can vary among geographic locations that span 100s to 1,000s of kilometers. Therefore, broad scale assessments are still needed throughout their ranges of influence in order to better understand how their impacts may vary along contiguous coastlines and among different ENSO events.
Over the past 5,000 years, the frequency of ENSO events has increased to a period of approximately 2 to 8.5 years (Rodbell et al. 1999), and their strengths have varied substantially with three of the strongest on record occurring after 1980 (NOAA MEI https://www.esrl.noaa.gov/psd/enso/mei/, Davey and Anderson 1998, Wolter and Timlin 1998). Indeed, since 2000, weak ESNOs have been observed in 2002–03, 2004–05, 2006–07, 2008–10, and a major event was observed in 2014–16. Currently, a weak ESNO is projected for 2019 (http://www.climate.gov/ENSO). Perhaps most important to the ecology of coastal kelp forests are ENSO-induced changes in ocean temperature and wave intensity (Jackson 1977, Dayton and Tegner 1984, 1990, Zimmerman and Robertson 1985, Seymour et al. 1989, Edwards and Estes 2006). Ocean temperature is negatively correlated with nutrient availability in the northeast Pacific Ocean such that when seawater temperatures exceed ~16°C they become nutrient limited (i.e., <1 μg NO3− L−1), which negatively affects kelp condition and survival (Gerard 1982, Zimmerman and Kremer 1984, Hernández-Carmona et al. 2001, Edwards and Estes 2006). Consequently, whereas the MEI may be the best measure by which to make general comparisons of the overall strength and timing of different ENSO events (Wolter and Timlin 1998), increases in ocean temperature and wave intensity are perhaps a better measure by which to contrast their potential impacts to kelp forests over large geographic regions. For example, the 1997–98 ENSO impacted giant kelp (Macrocystis pyrifera) populations along the west coast of North America most strongly at regional (100s km) spatial scales (Edwards 2004), causing near 100% mortality of individuals along the Baja California, México peninsula south of Punta Banda, roughly 80–90% mortality along southern California, USA between Punta Banda and Point Conception, and less than 10% mortality north of Point Conception (Edwards and Estes 2006). These geographic differences were driven by corresponding regional-scale patterns in ocean temperature and storm-induced wave energy (Edwards 2004). Recovery of the giant kelp populations, in contrast, was spatially variable and influenced by numerous biotic and abiotic forcing factors that operated across a range of spatial scales (Edwards 2004). Although the impacts of some ENSO events on giant kelp populations are rather well known along the California and Baja California coasts (e.g., Dayton and Tegner 1984, 1990, Zimmerman and Kremer 1984, Dayton et al. 1992, Hernández-Carmona et al. 2001, Ladah and Zertuche-González 2004, Edwards and Estes 2006), what is less clear is how these different ENSOs compare in the way ocean temperature and wave force interacted to impact giant kelp populations across this broad geographic range. To address this, a historical perspective of four previous ENSOs for which data are available from long-term monitoring programs is presented to inform how they, and perhaps future, ENSOs might be evaluated.
Data for giant kelp abundance, SST, and significant wave height were obtained from several long-term monitoring programs in order to contrast four ENSOs that occurred during a 20-year period between 1980 and 2000. These four ENSOs occurred during 1982–83, 1986–87, 1991–92, and 1997–98. Specifically, the strength and timing of these four ENSOs were compared to assess how they impacted giant kelp populations in three geographic regions along the west coast of North America. Unfortunately, many of the long-term monitoring programs that collected these data (e.g., kelp harvest data for kelp beds in California and Baja California from ISP Alginates, and the San Onofre subtidal monitoring data from Amec Environmental) stopped soon after the 1997–98 ENSO. As a consequence, information on kelp abundance during ENSOs that have occurred since 2000 (https://www.esrl.noaa.gov/psd/enso/mei/) were not available for this comparison. However, new lines of information on kelp populations have since started or become more readily available (e.g., PISCO – The Partnership for Interdisciplinary Study of Coastal Oceans, http://www.piscoweb.org/kelp-forest-study; and Reef Check, https://reefcheck.org/), and new avenues for analyzing satellite remote sensing data have been developed (e.g., Bell et al. 2015). Thus, future comparisons involving these ENSOs should be possible if these programs continue.
MATERIALS AND METHODS
Strength and timing of the ENSOs
Long-term data sets for the MEI, which provided a detailed comparison of the strength of each event as measured in the tropical Pacific Ocean, were used to contrast the strength and timing of four ENSOs that occurred between 1980 and 2000 (1982–83, 1986–87, 1991–92, and 1997–98). Data were downloaded from the NOAA-CIRES Climate Diagnostics Center’s web site (http://www.cdc.noaa.gov) and analyzed graphically. In addition, several long-term data sets for SST along Baja California, México, and southern and central California, USA were similarly examined. SST data for Baja California were provided for three 1° square (latitude × longitude) areas at Bahía Ensenada, Bahía Rosario, and Punta Eugenia by México’s Centro de Investigaciónes Biológicas del Noroeste (CIBNOR) in La Paz, BCS, and were recorded as monthly averages. SST data for southern California were collected at three locations; the SCRIPPS Institution of Oceanography’s pier, University of California, San Diego, and the National Oceanic Atmosphere Administration’s Weather Buoys near Santa Monica (buoy 46025, 33°75′ N, 119°08′ W)and Santa Barbara (buoy 64053, 32°24′ N, 119°85′ W) (http://www.ndbc.noaa.gov/). SST data for central California were also collected at three locations: Hopkins Marine Station, Stanford University, Pacific Grove, CA; Granite Canyon Marine Pollution laboratories, California Department of Fish and Game, Big Sur coast, CA; and the Santa Cruz boat harbor, Santa Cruz, CA. All data collection dates were converted to their respective Julian day relative to the start of each ENSO year in order to facilitate comparisons of the timing among ENSOs, and SST data for southern and central California were smoothed to five-day running averages to remove high-frequency variability that would likely not impact giant kelp condition. It is important to again note that giant kelp occurring in temperatures above ~16°C for extended periods become nutrient stressed and senescent (Gerard 1982, Zimmerman and Robertson 1985, Hernández-Carmona et al. 2001). This threshold, however, may be slightly elevated at 17°C along Baja California (Edwards and Estes 2006). Ocean wave force data were recorded as significant wave height and dominant wave period, and were obtained for single offshore locations in southern (Catalina weather buoy 46025, 33°75′ N, 119°08′ W) and central (Santa Maria weather buoy 46011, 34°88′ N, 120°87′ W)California from the National Oceanic AtmosphereAdministration’s Weather Buoy Data web page. No wave force data were available for Baja California during this time period. The corresponding estimates of wave intensity, defined here as horizontal orbital displacement (DH), were calculated at the surface over 12 m depth using the equation:
where ht = significant wave height; d = depth of water (12 m), g = gravitational acceleration; and p = dominant wave period (Denny 1988).
Impacts to giant kelp forests
Long-term data sets for giant kelp, Macrocystis pyrifera (C. Agardh), abundance in three geographic regions (Baja California, southern California, and central California) were analyzed to contrast the broad scale impacts of the four ENSOs on their populations. Specifically, for southern California, this included a combination of visual estimates of kelp canopy biomass (measured in wet tons) that were obtained for kelp beds at Point Loma in San Diego County and Naples Reef in Santa Barbara County (provided by D. Glantz, ISP Alginates Inc., San Diego, CA, USA), and in situ diver counts of kelp density that were obtained from long-term subtidal monitoring programs for kelp beds at San Onofre–San Diego County (provided by L. Honma, AMEC Earth and Environmental Services, San Diego, CA, USA) and San Nicolas Island–Los Angeles County (provided by J. Estes and M. Kenner, University of California Santa Cruz, Santa Cruz, CA, USA). For central California, this included a combination of visual estimates of kelp canopy biomass that were obtained for kelp beds along the northern side of Point Conception in Santa Barbara County (provided by D. Glantz, ISP Alginates Inc., San Diego, CA, USA), and aerial photographs of the canopies for two kelp beds in the Monterey Bay; Otter Point and Lovers Point (provided by C. Harrold and S. Lisin–Monterey Bay Aquarium, Monterey, CA, USA). For these, the date of maximum canopy area was visually identified for each year, the images for those dates digitized, and estimates of maximum canopy abundance (in km2) for each year determined using Image J image analysis software (National Institutes of Health, Bethesda, MD, USA). For Baja California, kelp harvest records were used as a proxy for kelp canopy biomass integrated across the species range along the peninsula (provided by G. Hernández-Carmona–Centro Interdisciplinario de Ciencias Marinas, La Paz, BCS, México). All kelp data sets were examined over a 22-year period (1978–2000), except for subtidal counts at San Nicolas Island, which were examined over a 19-year period (1980–99), and aerial photos in Monterey County, which were evaluated over an 18-year period (1981–98). Changes in kelp abundance were then assessed graphically and evaluated against the corresponding changes in SST, wave force (DH), and the timing of when the largest waves arrived at the coast relative to when the ocean waters cooled in each of the three regions.
RESULTS
Strength and timing of the ENSOs
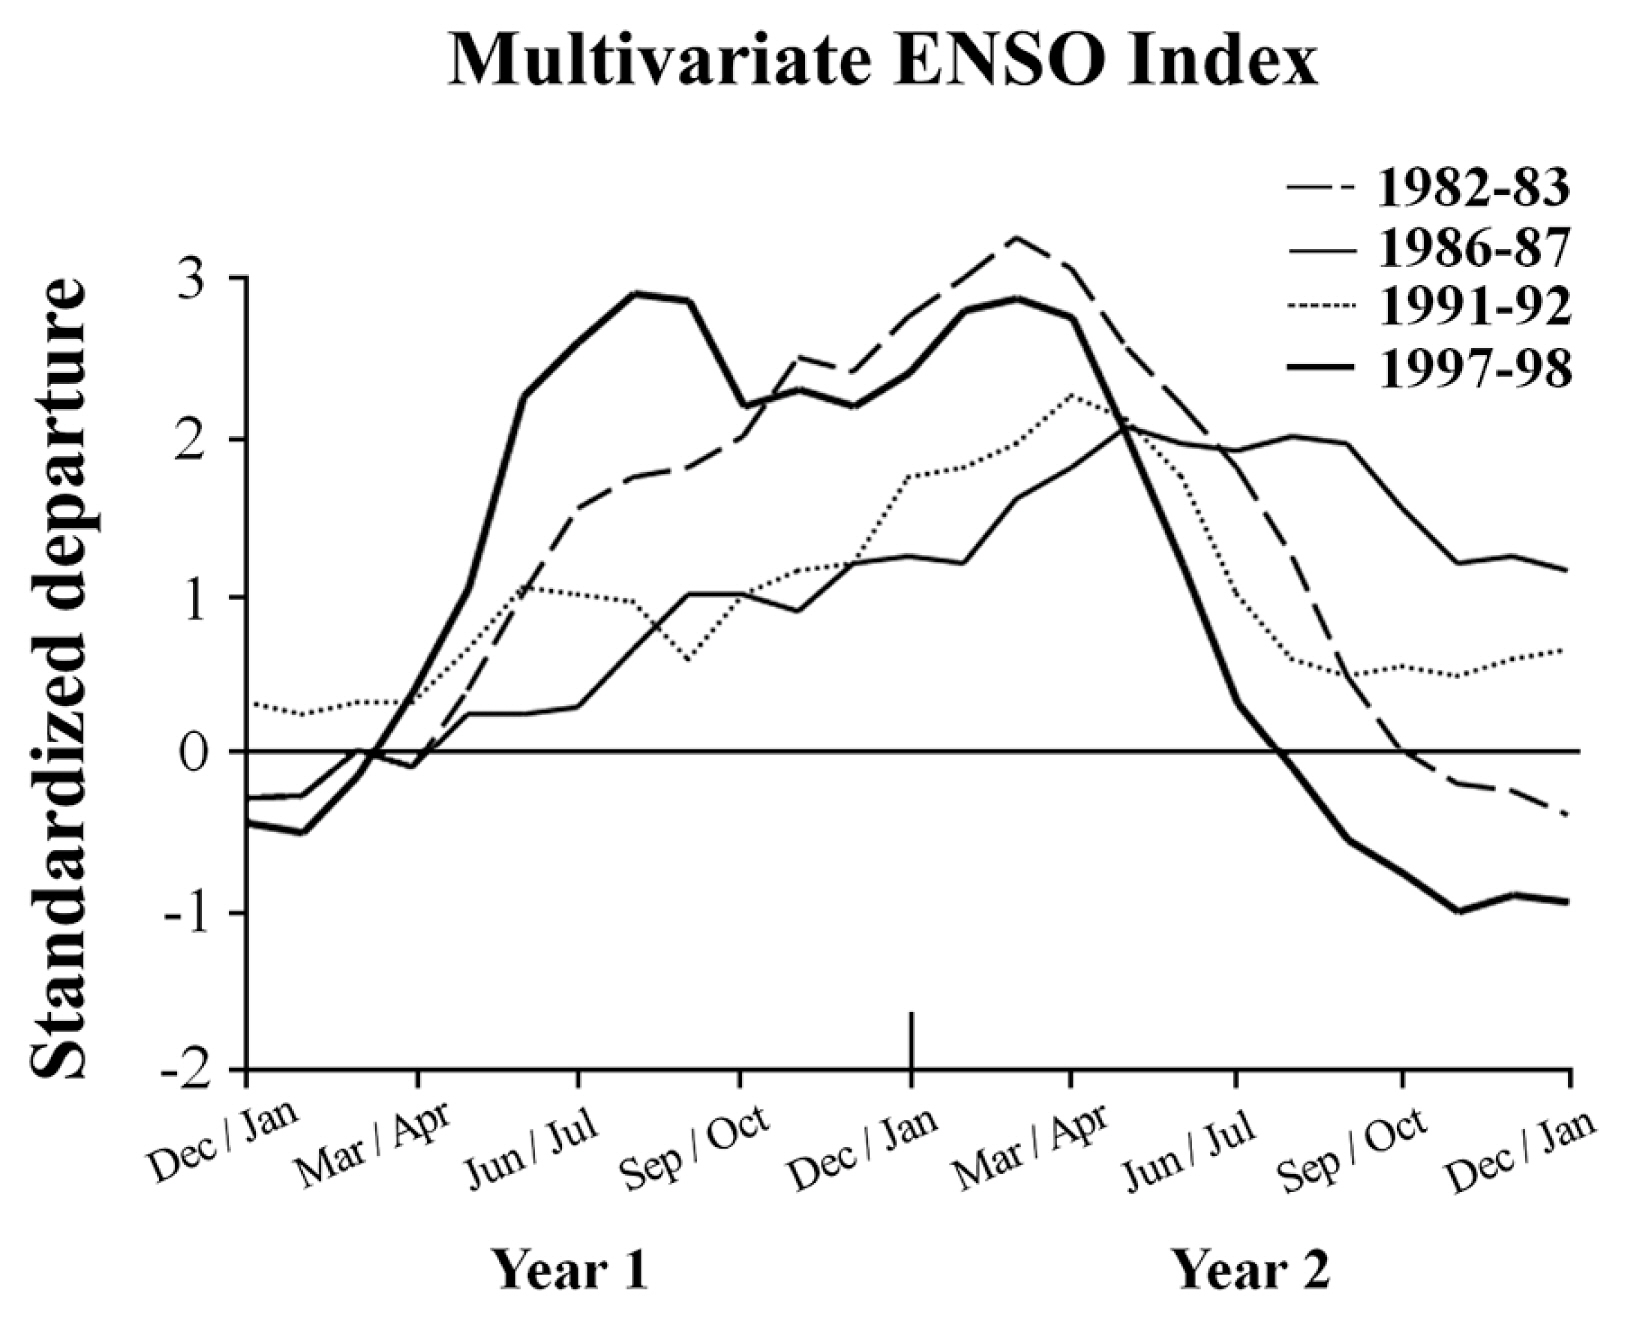
As previously reported by Wolter and Timlin (1998), the 1982–83, 1986–87, 1991–92, and 1997–98 ENSOs differed in their strength and timing as measured in the tropical Pacific by the MEI. Briefly, the 1982–83 and 1997–98 ENSOs were substantially stronger than the 1986–87 and 1991–92 ENSOs, and are still considered to be two of the strongest ENSOs ever recorded. Further, the 1997–98 ESNO developed rapidly and exhibited two peaks in strength, in July/August 1997 and again in March/April 1998, while the other three ENSOs developed more slowly and exhibited a single peak in strength, roughly during March/April of their respective second years (Fig. 1). The 1982–83, 1991–92, and 1997–98 ENSOs then all weakened and ended the following year, with the 1982–1983 and 1997–98 ENSOs declining to strong negative MEI values, indicating the onset of La Niña conditions by the following June/July and September/October, respectively. In contrast, the 1991–92 ENSO declined only moderately to near-neutral values by the following June/July, while the 1986–87 ENSO declined exhibited only a small decline, remaining in positive MEI values. The rapid transition from strong ENSO conditions to such strong La Niña conditions following the 1997–98 ENSO was unprecedented in the 50-y history of the MEI (Hayward 2000).
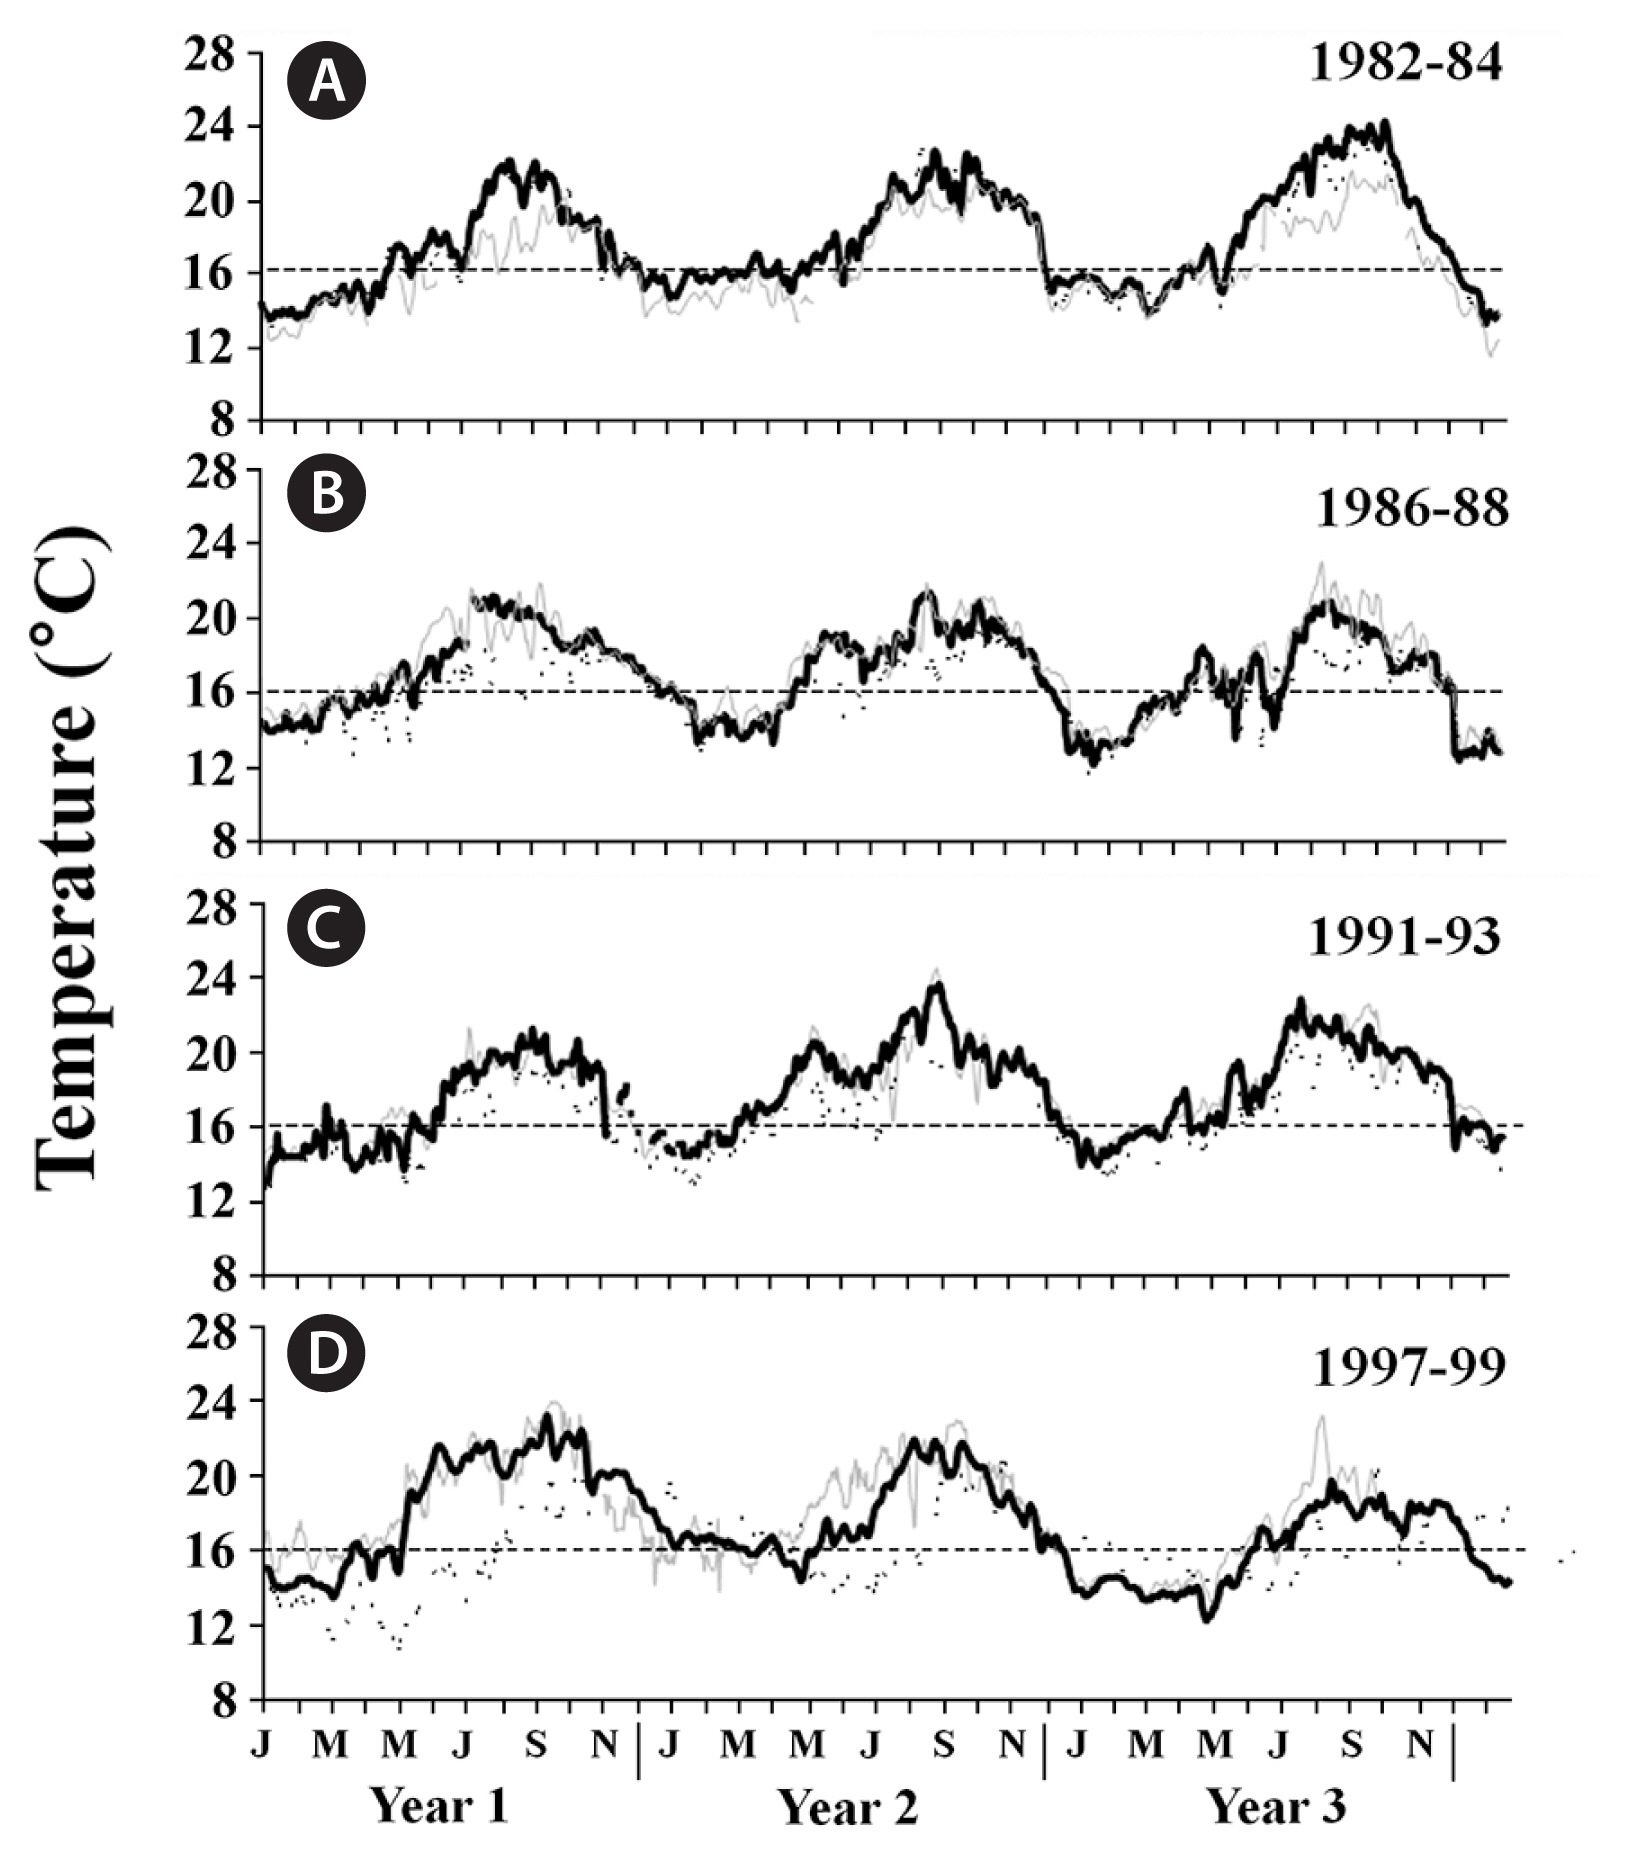
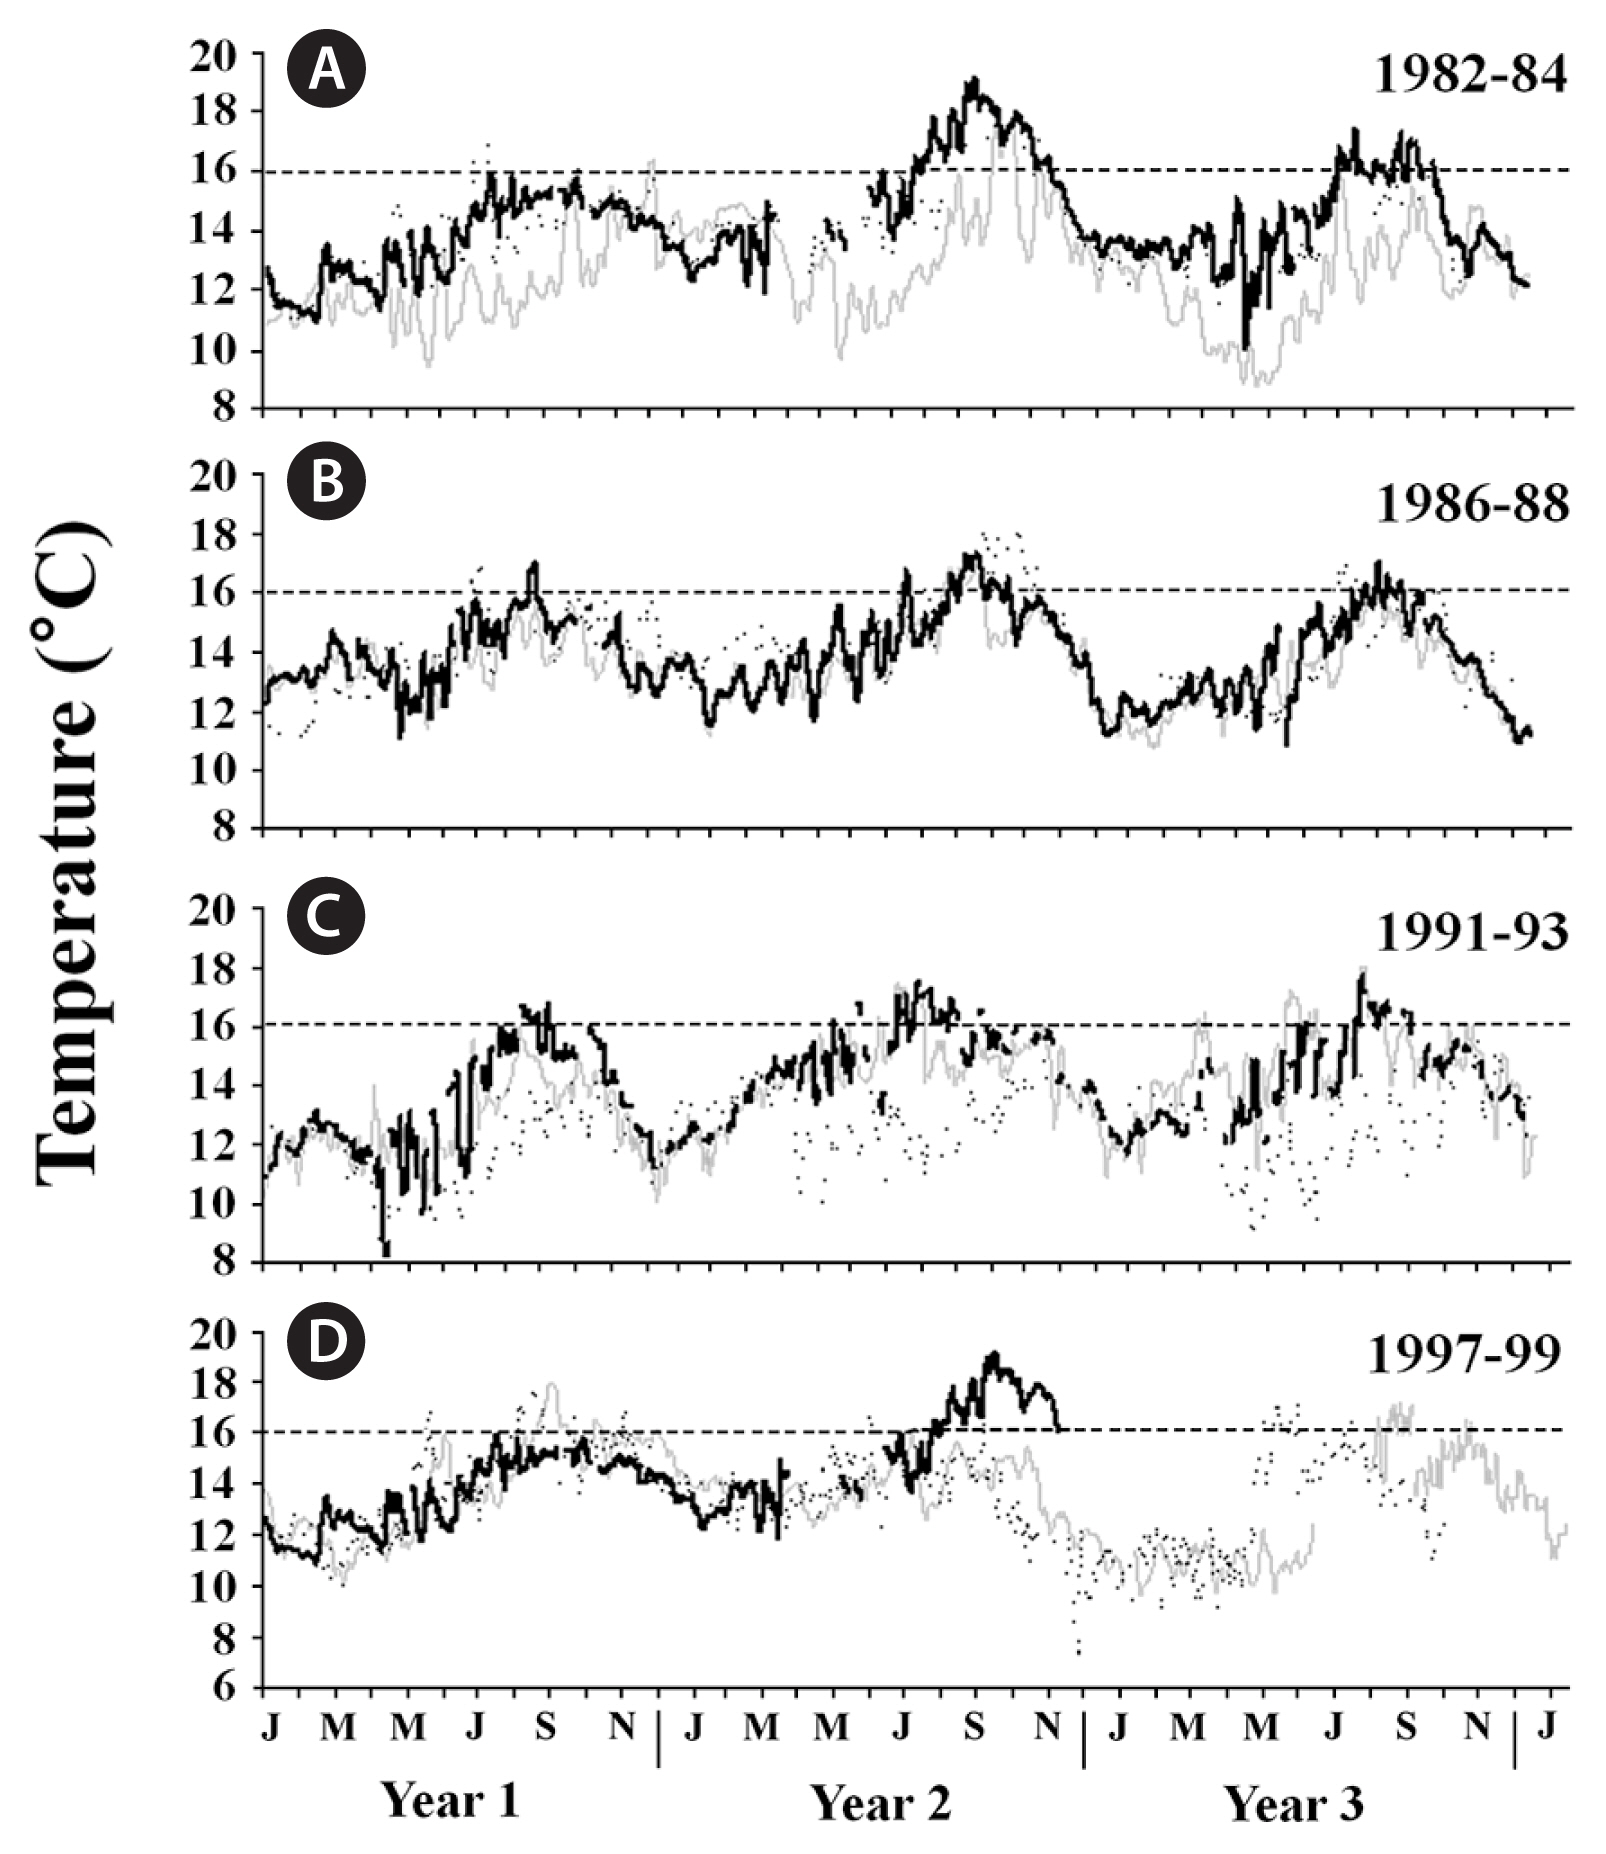
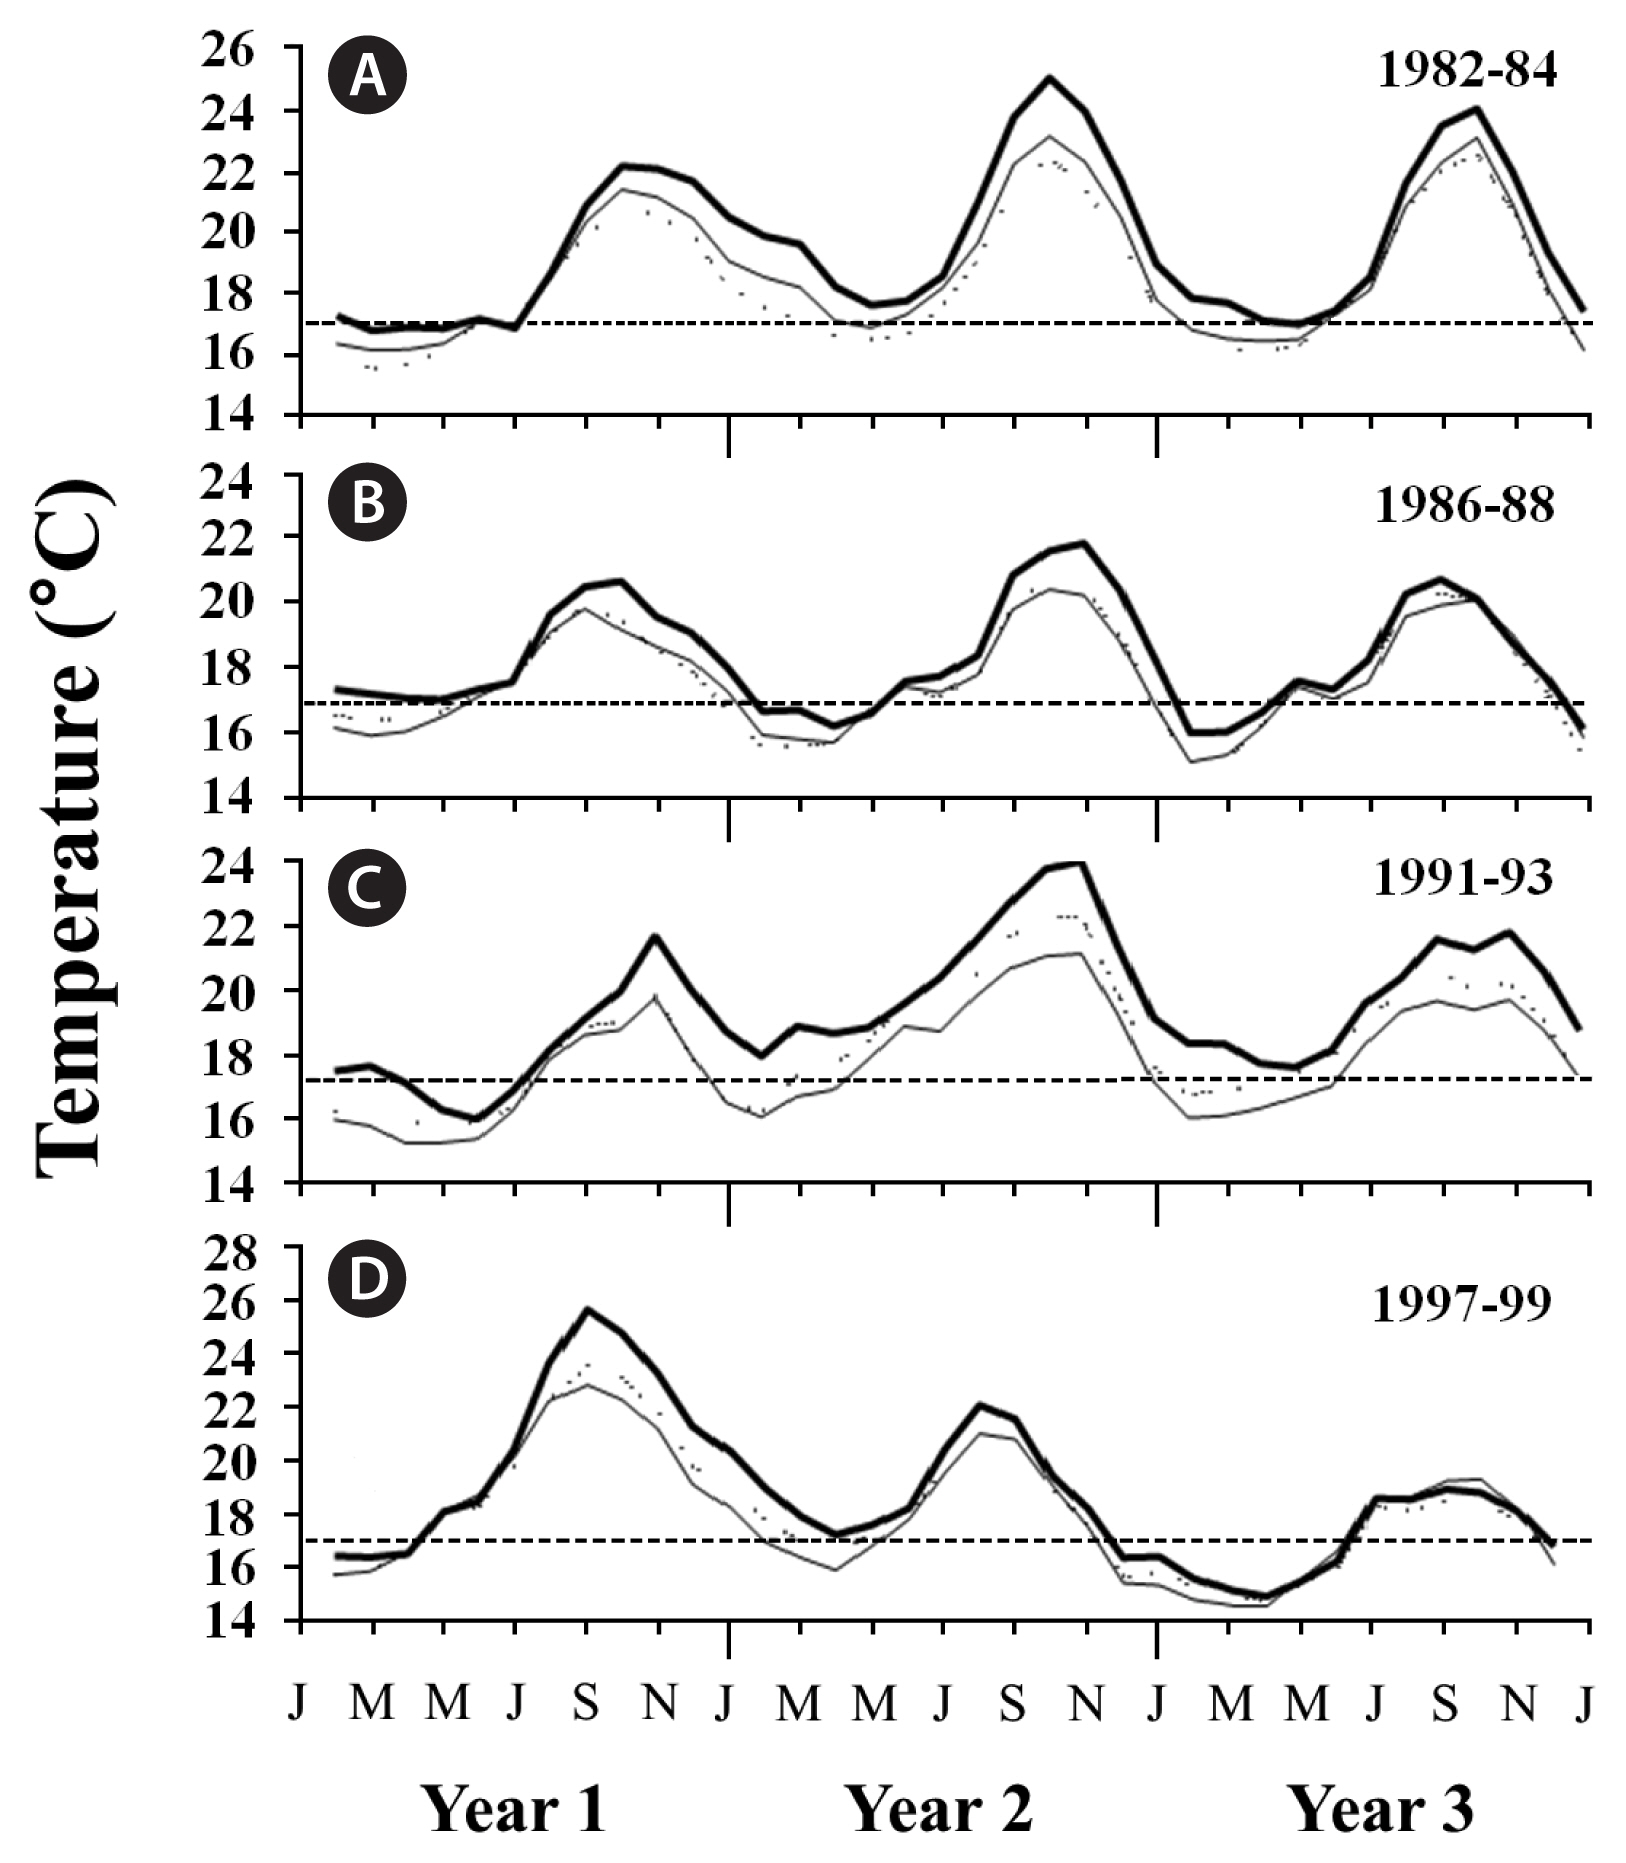
SSTs in all three geographic regions followed expected seasonal patterns during each ENSO, with the warmest waters observed during the summer and coolest waters observed during the winter (Figs 2–4). However, when examined within each region separately, differences among the four ENSOs became clearer. In particular, SSTs in southern California varied among the four ENSO events, with the 1982–83 and 1997–98 ENSOs generally having higher SSTs than the 1986–87 and 1991–92 ENSOs (Fig. 2A–D). Further, the anomalously warm waters arrived earlier (April/May) during the 1997–98 ENSO than they did during the 1982–83 event (June/July), although this was geographically variable. Following each of these two strong ENSOs, SSTs declined to below 16°C, thereby returning adequate nutrient conditions for kelp growth (e.g., Zimmerman and Kremer 1984, Hernández-Carmona et al. 2001, Edwards and Estes 2006), though this too varied among the ENSOs. Specifically, SSTs following the 1997–98 ENSO were cooler than following the 1982–83 event and showed signs of La Niña conditions (see also Hayward 2000) (Fig. 2D), while SSTs following the 1982–83 ENSO remained anomalously warm, reaching nearly 24°C in the following summer (Fig. 2A). In contrast to these two strong events, maximum SSTs were approximately 2°C cooler at the study locations during the 1986–87 and 1991–92 ENSOs, again indicating these two events were weaker. Furthermore, much like the 1997–98 ENSO, the 1986–87 ENSO was followed by cooler La Niña conditions, whereas the 1991–92 ENSO was followed by even warmer ocean temperatures, suggesting that like the 1982–83 ENSO, it was not followed by La Niña conditions (Fig. 2B & C). In central California, SSTs followed a similar but less pronounced pattern to those in southern California, though they only occasionally exceeded 16°C (Fig. 3A–D), suggesting these populations were rarely nutrient-depleted (Edwards and Estes 2006). SSTs in Baja California also followed similar patterns to those in southern California, although they were greater in magnitude, with temperatures exceeding 24°C during each ENSO, and reaching 28°C near giant kelp’s southern limit in Baja California Sur during the 1997–98 ENSO (Fig. 4A–D) (see also Hernández-Carmona et al. 2001). This suggested that giant kelp populations were not only nutrient-limited, they were also possibly temperature stressed during long periods of time during and following each ENSO.
Ocean waves intensity, as estimated by horizontal orbital displacement (DH) modelled at the benthos, varied among the four ENSOs in both southern and central California (unfortunately, ocean wave data were not available for Baja California during this time-period). Specifically, ocean waves were generally larger in central California, occasionally exceeding 8 m in height and 20 m orbital displacements (DH), during the 1982–83 and 1997–98 ENSOs than during the 1986–87 and 1991–92 ENSOs (Fig. 5A–D). Further, with the exception of a few very large wave events that impacted the coast in February/March 1983, ocean waves were also generally larger during the 1997–98 ENSO than during the 1982–83 ENSO in both regions (see also Hayward 2000). Perhaps more important than these differences in wave energies, the four ENSOs differed with respect to the timing of when the large wave events (i.e., those with >3 m significant wave heights) (Dayton and Tegner 1984) impacted the coast relative to when the ocean warmed and cooled in the different regions. These differences were particularly important for contrasting the 1982–83 and 1997–98 ENSOs. Specifically, the large wave events impacted the coast earlier in the year during the 1997–98 ENSO (October) than during the 1982–83 ENSO (December). Consequently, when the first destructive waves impacted the kelp forests in southern California in October 1997, the ocean temperatures were still above 16°C and had been so for many months, suggesting the kelp was nutrient stressed (Gerard 1982, Zimmerman and Robertson 1985, Hernández-Carmona et al. 2001, Edwards and Estes 2006). In contrast, when the first destructive waves arrived in southern California in December 1982, SSTs had already cooled to below 16°C, suggesting that the kelp were no longer nutrient stressed (Figs 3A & 6A). In contrast, when these waves impacted the coast of central California, SSTs were below 16°C, and thus the kelp were likely not nutrient stressed. Finally, ocean temperatures were cooler and ocean waves smaller in both central and southern California during both the 1986–87 and 1991–92 ENSOs than the 1982–83 and 1997–98 ENSOs, again indicating these were weaker events and suggesting their impacts to giant kelp populations should be smaller (Fig. 6B & C).
Impacts to giant kelp forests
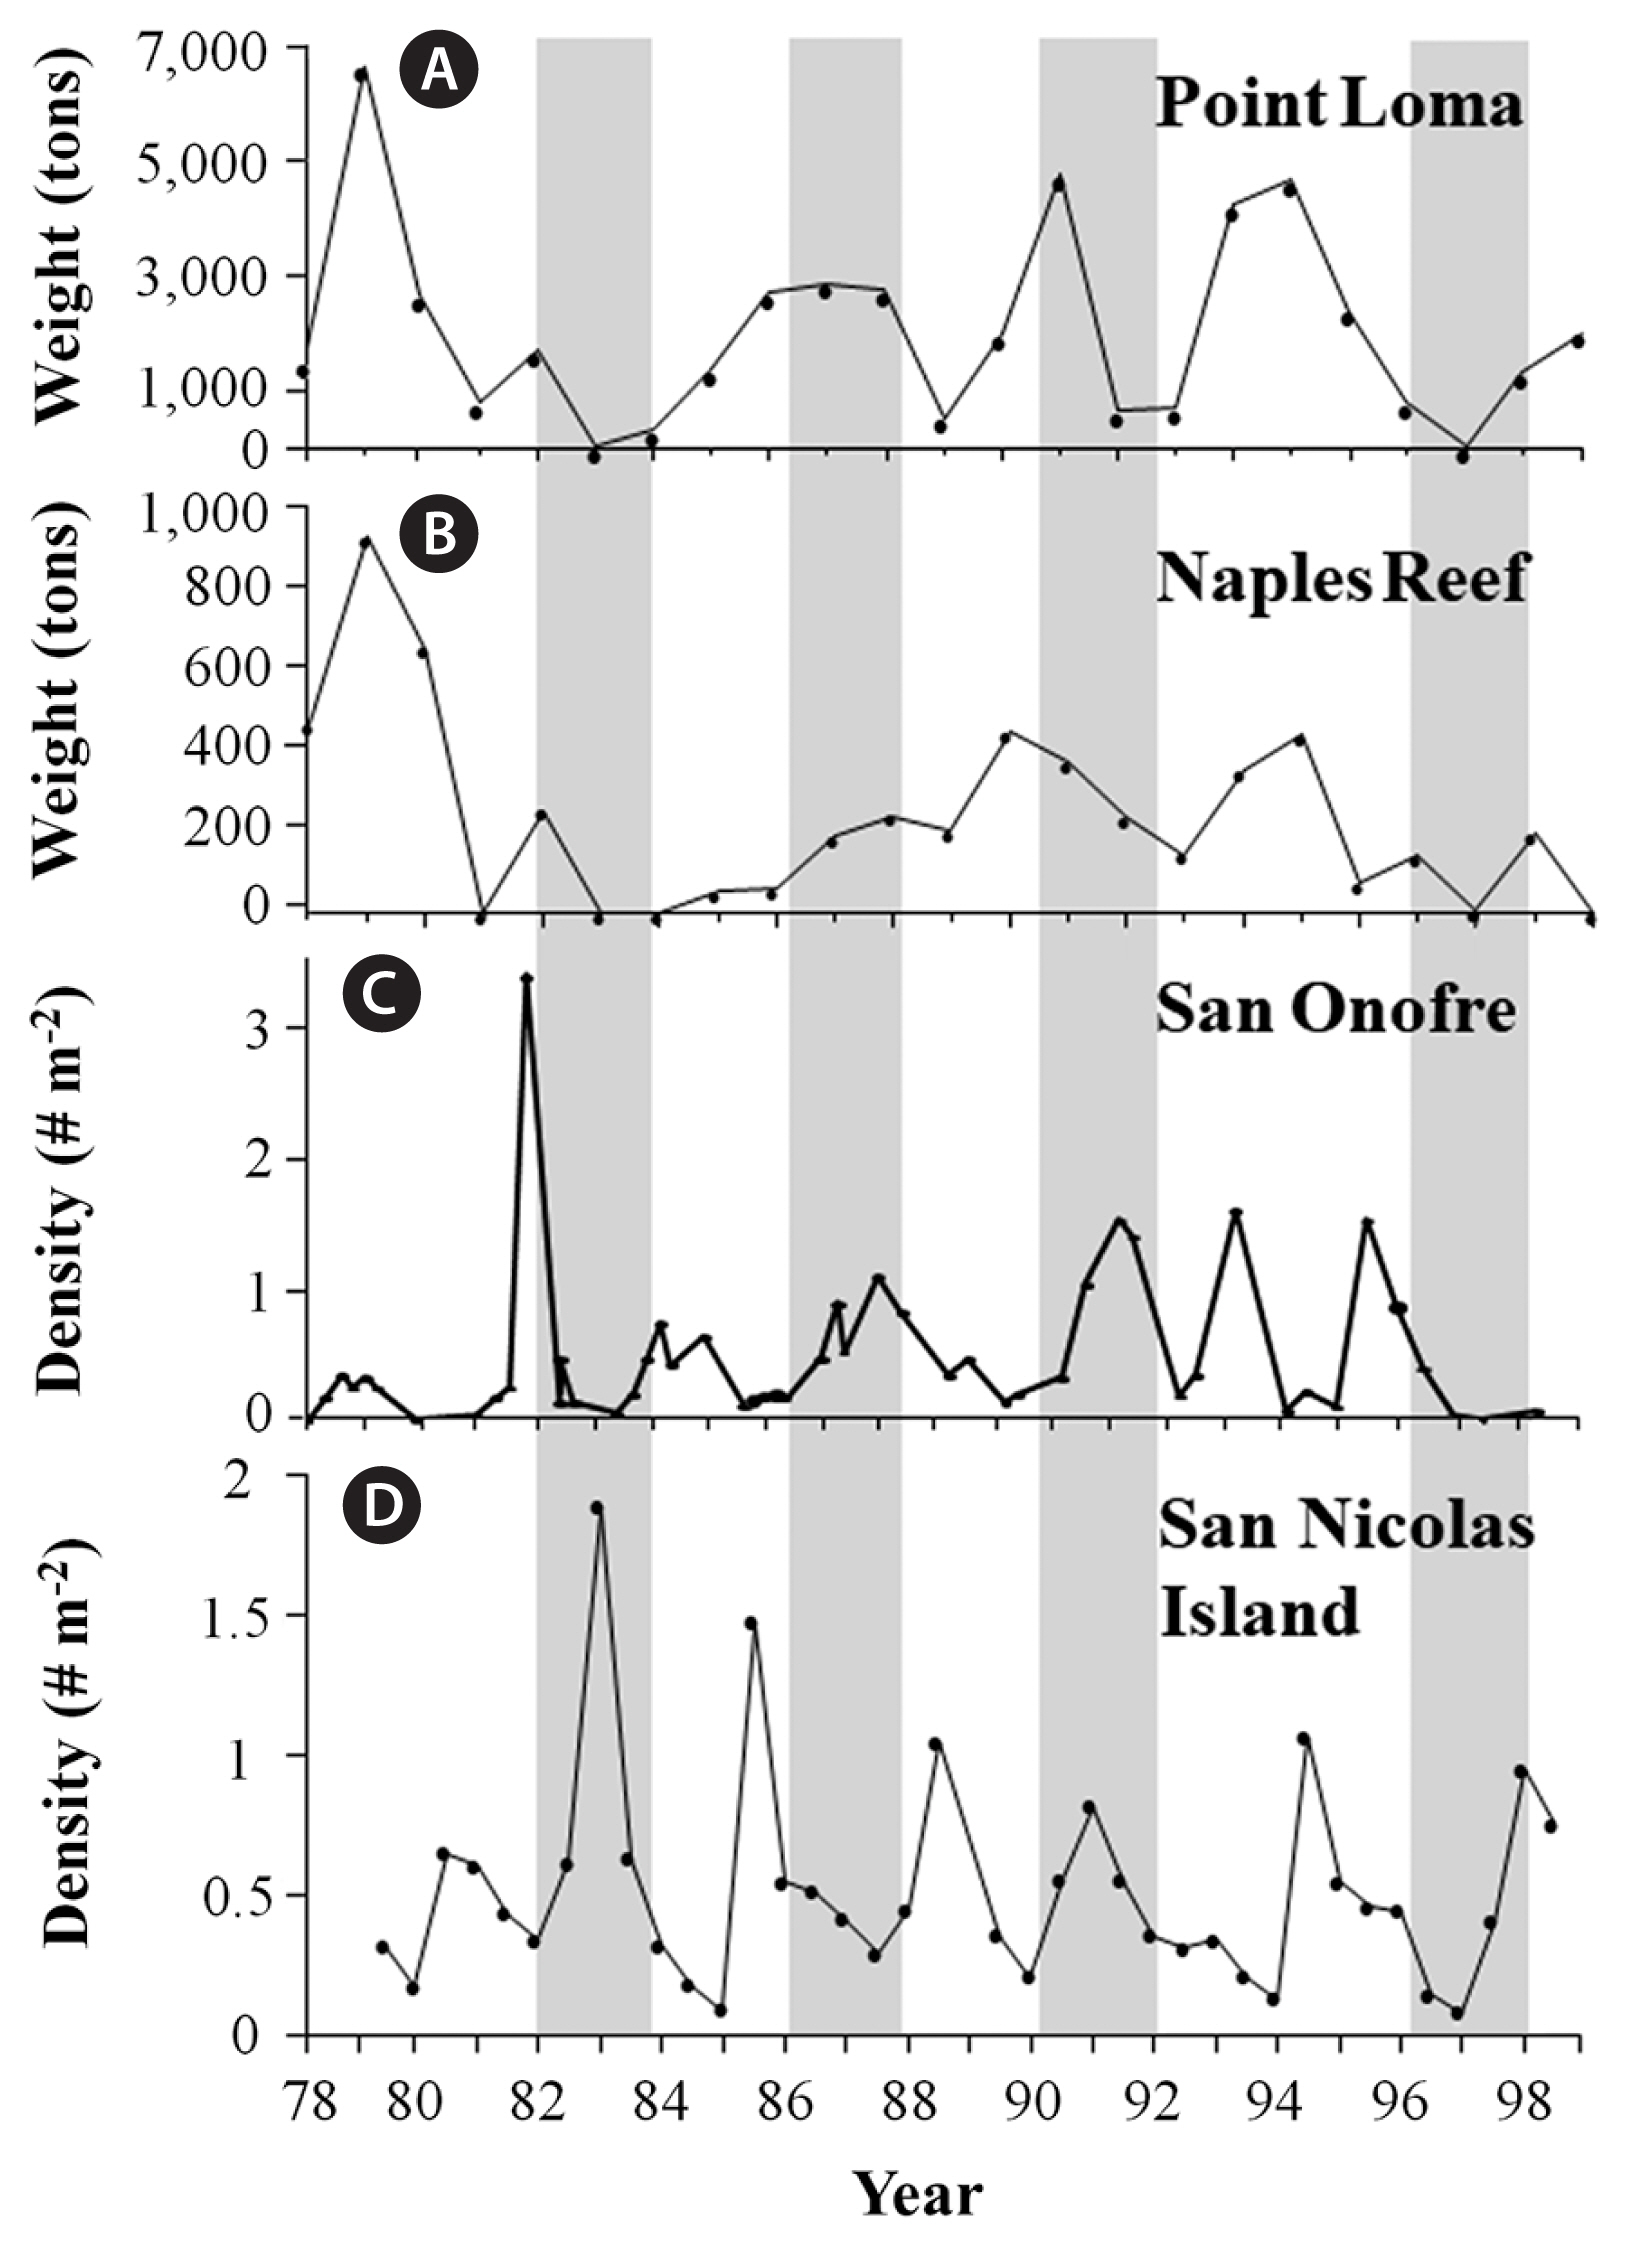
The four ENSOs differed markedly with respect to their impacts on giant kelp populations along the west coast of North America, with the 1982–83 and 1997–98 ENSOs being generally more destructive than the 1986–87 or 1991–92 ENSOs. Both these strong ENSOs resulted in the near total loss of all giant kelp at all locations in southern California, except at San Nicolas Island where giant kelp increased during the first year of the 1982–83 ENSO (Fig. 6). The giant kelp populations then showed signs of recovery at each of these locations following these ENSOs, except for Point Loma and Naples Reef where heavy recruitment of sub-canopy kelps and a dense outbreak of herbivorous urchins, respectively, delayed giant kelp recovery. One exception was again, San Nicolas Island, where giant kelp decreased substantially following the 1982–83 ENSO. In contrast, the 1986–87 ENSO corresponded with moderate increases in kelp abundance at all locations but San Nicolas Island, where it decreased (Fig. 6). Lastly, giant kelp decreased in abundance at Point Loma and Naples Reef, but increased in abundance at san Onofre and San Nicolas Island.
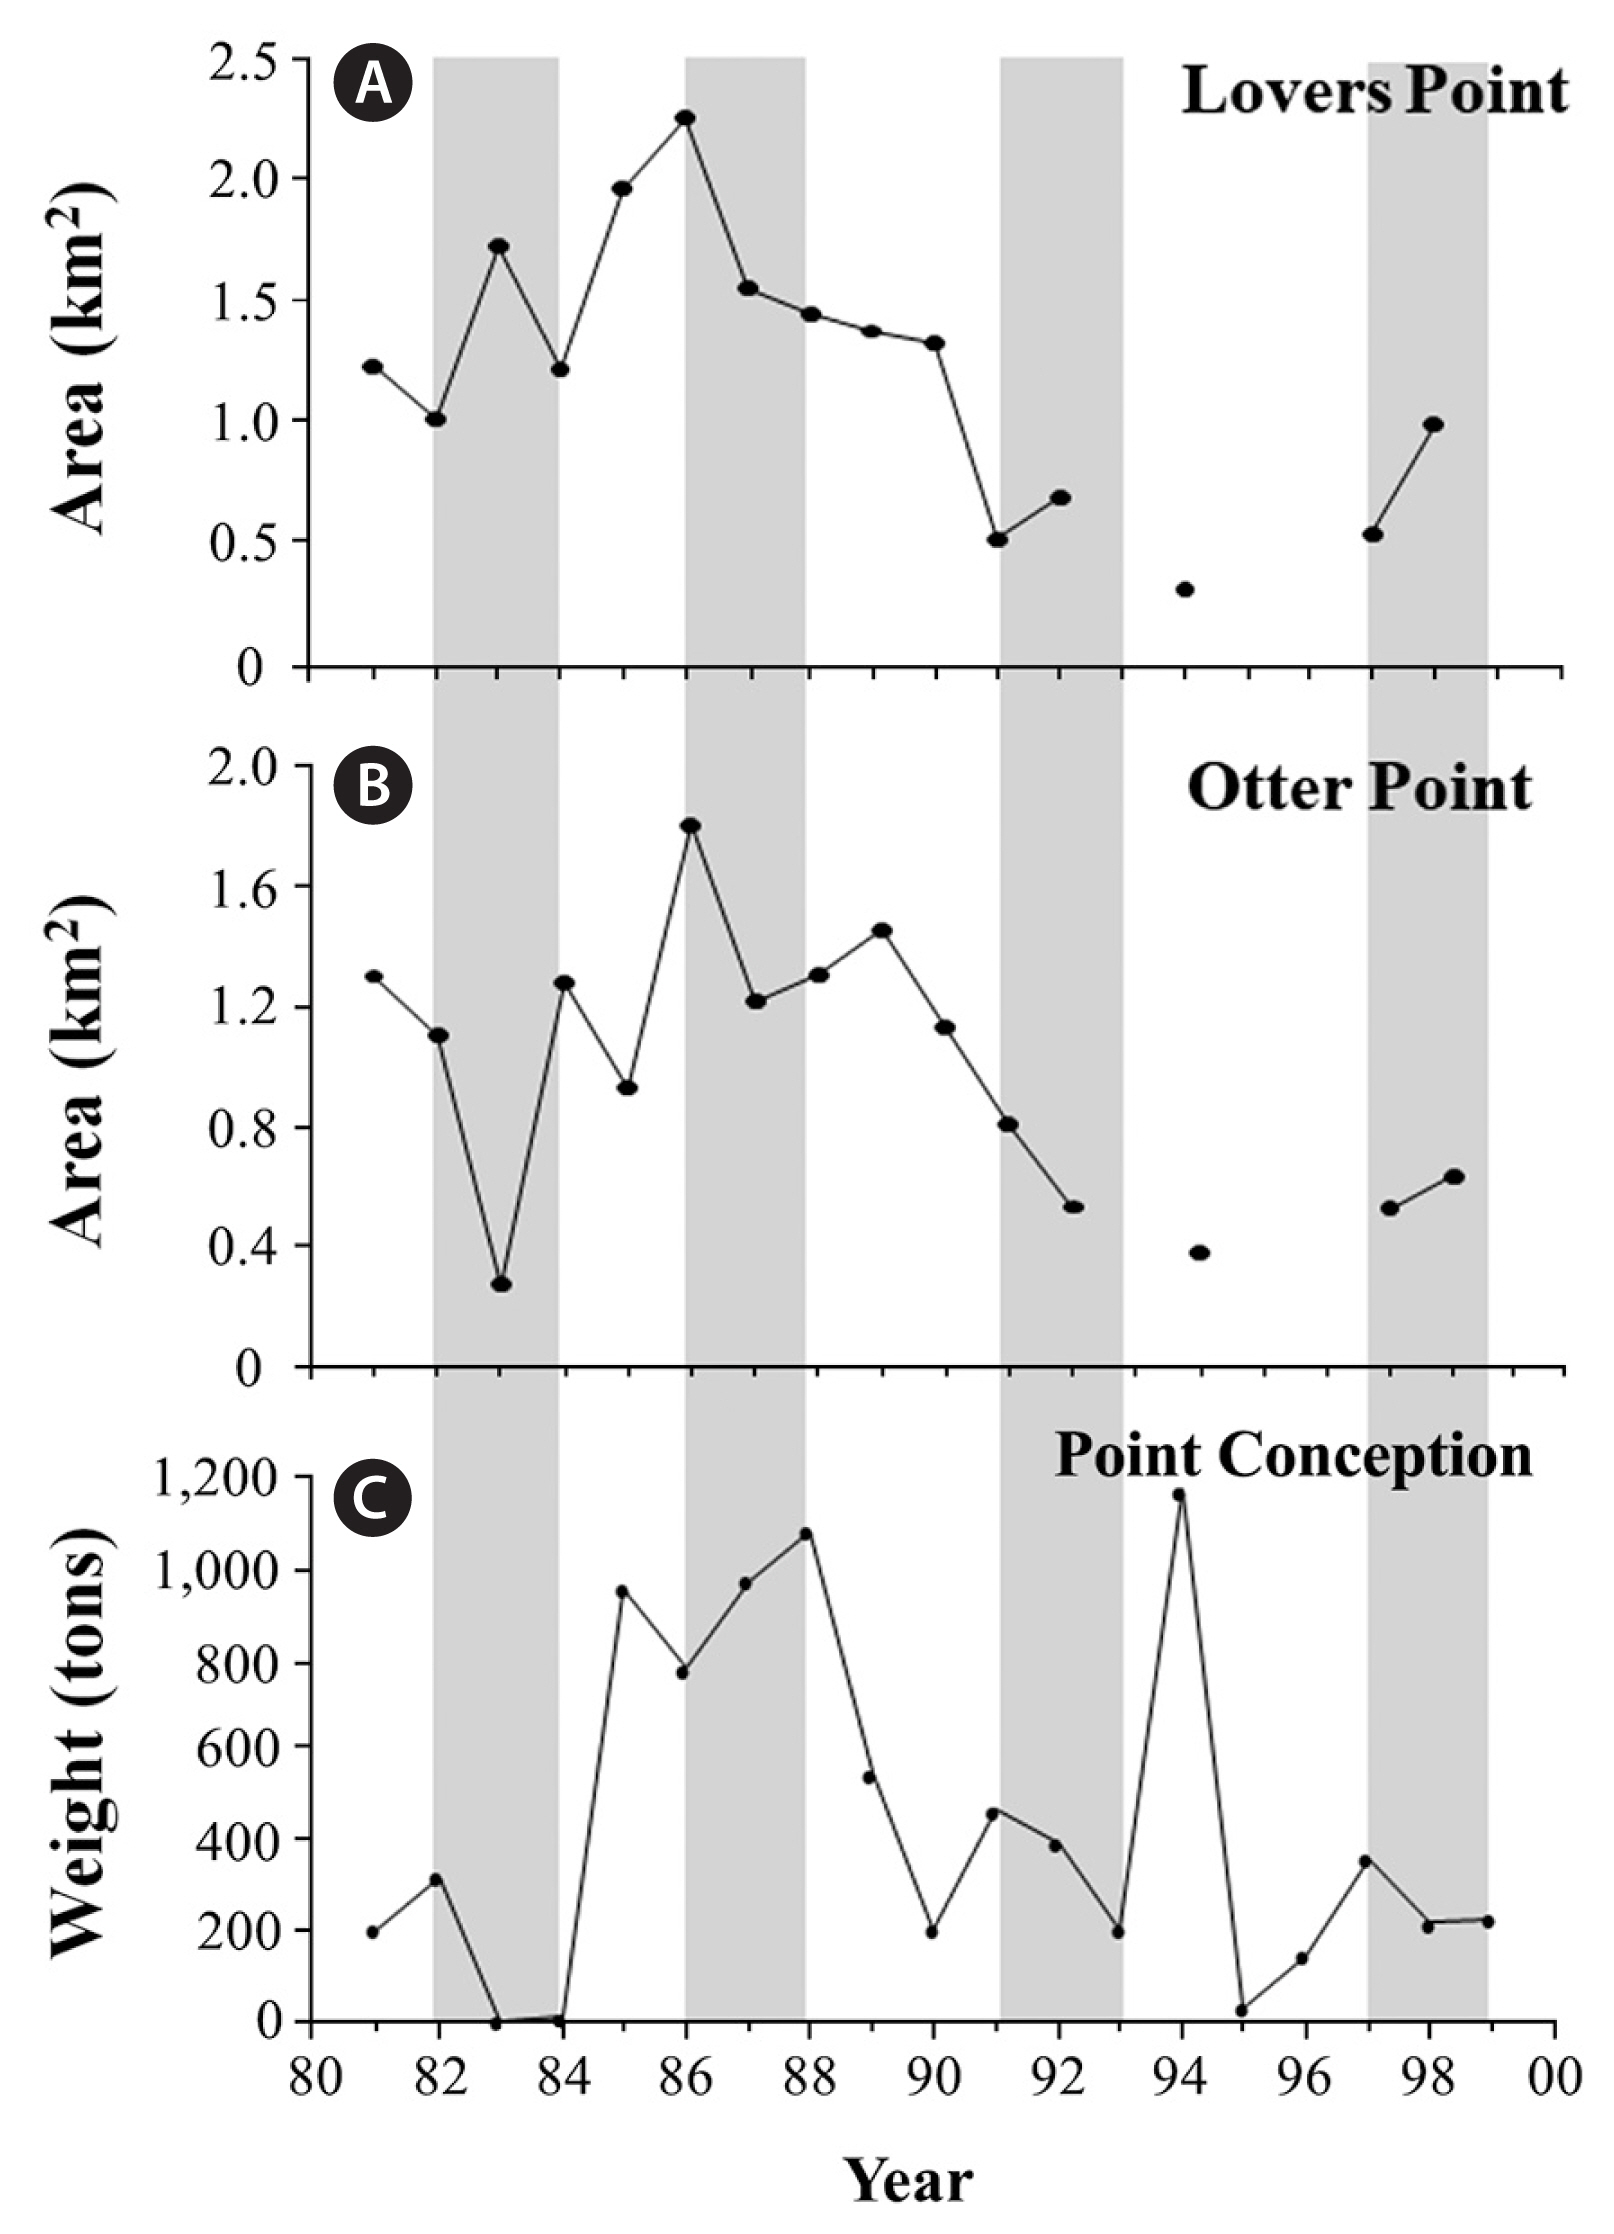
In central California, the 1982–83 ENSO was generally more destructive to giant kelp populations than the 1986–87, 1991–92, or the 1997–98 ENSOs, though this was more pronounced at more wave exposed locations (e.g., Point Conception and Otter Point) than wave protected locations (e.g., Lovers Point) (Fig. 7). Further, and in contrast to patterns observed in southern California, the 1997–98 ENSO was not more destructive than the 1986–87 and 1991–92 ENSOs. Rather, the 1997–98 ENSO resulted in only minor losses of giant kelp at Point Conception, while increases in abundance were observed at Otter Point and Lovers Point (Fig. 7). However, it should be noted that giant kelp was already in low abundance at these sites prior to the ENSO. These patterns are in agreement with subtidal surveys of giant kelp density conducted at these and other sites during this period by Edwards and Estes (2006).
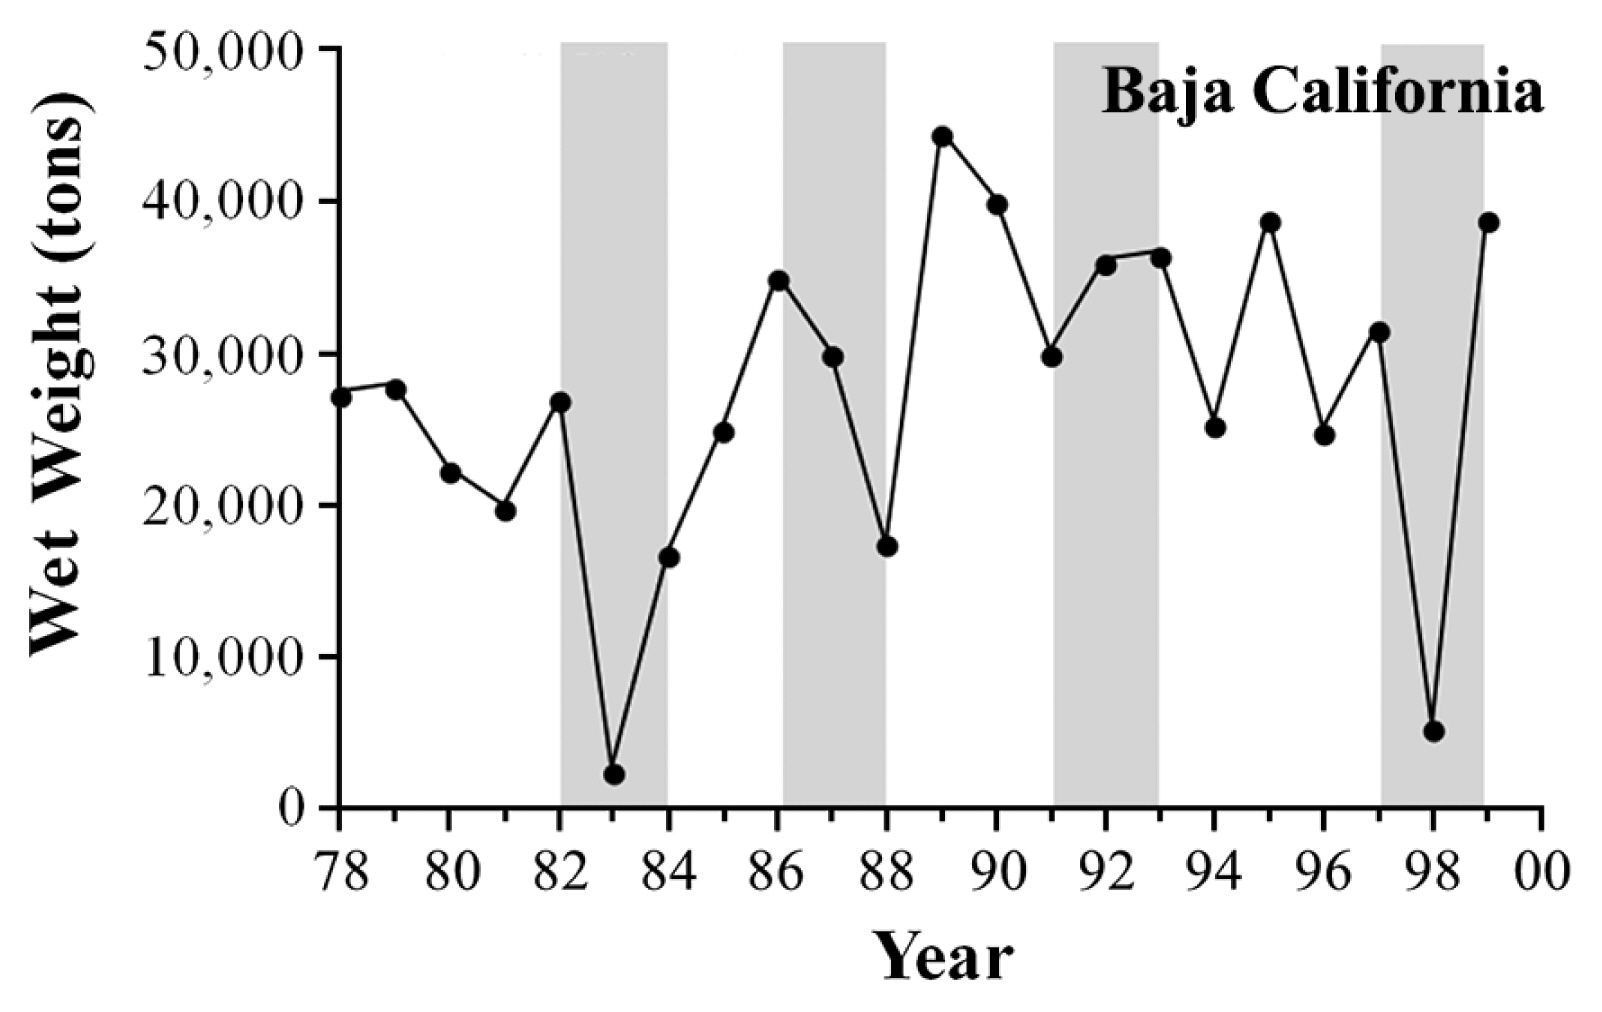
Finally, the four ENSOs differed substantially as to how they impacted giant kelp harvest along Baja California, used here as a proxy for giant abundance. Similar to, but more extreme than, patterns observed in southern and central California, the 1982–83 and 1997–98 El Niños were far more destructive to giant kelp populations in Baja California than the 1986–87 and 1991–92 ENSOs. Specifically, harvest of giant kelp canopies was reduced substantially during both the 1982–83 and 1997–98 ENSOs, and moderately during the 1986–87 ENSO, but not during the 1991–92 ENSO (Fig. 8).
DISCUSSION
LIDs are an important part of natural ecosystems (e.g., fires in terrestrial plant communities: Keeley 1987, Carleton and MacLellan 1994, Tyler 1996; hurricanes in tropical coral reef communities: Connell et al. 1997; oil spills in rocky intertidal communities: De Vogelaere and Foster 1994). Unfortunately, their impacts on biological populations are seldom fully understood, largely because of the difficulties associated with studying them over large geographic areas and because of their unpredictable nature. These difficulties are perhaps even more evident for studies that attempt to contrast the impacts of different large-scale disturbances (Turner and Dale 1998). Here, by understanding that ENSOs impact giant kelp forests in the northeast Pacific Ocean at very large (regional) spatial scales (Edwards 2004), it was possible to more clearly contrast the broad scale (100s to 1,000s km) impacts of four ENSOs that occurred between 1980 and 2000 on giant kelp populations along the west coast of North America. Specifically, this allowed for a comparison of these impacts among central, southern and Baja California. Unfortunately, it was not possible to extend these contrasts to more recent ENSOs that have occurred since 2000, including the major event in 2014–16, due to the fact that several of the data sets used stopped collecting data or became unavailable (e.g., those at San Onofre, ISP Alginates, aerial photos of Monterey peninsula).
In general, the four ENSOs differed substantially in their timing, strength and how they impacted giant kelp populations along the west coast of North America. Specifically, atmospheric and oceanographic variables as represented by the MEI in the tropical Pacific Ocean, along with SST and ocean wave intensity as measured in the northeast Pacific, all indicate that the 1982–83 and the 1997–98 ENSOs were much stronger than the 1986–87 and 1991–92 ENSOs, and in fact, are still considered to be two of the strongest ENSOs on record (see also Wolter and Timlin 1998). Consequently, these two ENSOs were far more destructive to giant kelp populations in both southern and Baja California than either the 1986–87 or 1991–92 ENSOs, with differences due primarily to variability in the timing and magnitude of the destructive ocean wave events relative to when the ocean waters warmed and cooled. Indeed, the 1982–83 and 1997–98 ENSOs were characterized by longer periods of anomalously warmer ocean temperatures than the 1986–87 or 1991–92 ENSOs. As a result, they were presumably accompanied by greater nutrient stress in giant kelp (e.g., Zimmerman and Robertson 1985, Hernández-Carmona et al. 2001). Furthermore, temperatures in Baja California reached 28°C in some locations, likely resulting in severe mortality due to thermal stress alone (Hernández-Carmona et al. 2001, Edwards and Estes 2006). In addition, the 1982–83 and 1997–98 ENSOs generated larger ocean waves than the 1986–87 and 1991–92 ENSOs, with significant wave heights exceeding 8 m (50 m orbital displacements), resulting in greater losses by physical dislodgement. However, when contrasting the two stronger ENSOs, the destructive waves generated by the 1997–98 ENSO were nearly twice as abundant and arrived earlier in the year than those generated by the 1982–83 ENSO. Consequently, when these waves impacted the giant kelp in southern California in 1997, ocean waters were still above 16°C and the giant kelp were presumably still nutrient stressed due to the negative relationship between ocean temperature and nutrient availability (Gerard 1982, Zimmerman and Kremer 1984, Hernández-Carmona et al. 2001, Edwards and Estes 2006). In contrast, when the destructive waves impacted the giant kelp in southern California in 1982, the ocean waters had already cooled to below 16°C and the giant kelp had presumably already recovered from nutrient stress. In addition, the largest waves impacted the southern California coast during periods of extreme tidal changes that could have further increased orbital displacements (Denny 1988) and thus physical drag on the giant kelp. Therefore, although the giant kelp in southern California suffered substantial losses during the 1982–83 ENSO (see also Dayton and Tegner 1984, 1990), these losses were not as severe as those observed during the 1997–98 El Niño (Edwards and Estes 2006). The exception was San Nicolas Island, where losses to the giant kelp canopy were greater during the 1982–83 El Niño than the 1997–98 ENSO. However, this may be because ocean temperatures around San Nicolas Island are cooler than they are throughout much of the rest of southern California and the giant kelp may not have suffered the same degree of nutrient stress as they did throughout the rest of southern California.
Similar to southern California, the 1982–83 ENSO was more destructive to the giant kelp populations in central California than either the 1986–87 or 1991–92 ENSOs. However, unlike in southern California, the impacts of the 1997–98 ENSO were not severe, and were similar to those observed during the 1986–87 and 1991–92 ENSOs. These differences were correlated with the anomalously warm ocean waters observed in each region; in central California, ocean waters remained cool and never appeared to become nutrient limited, and therefore the giant kelp were never believed to be nutrient-stressed (Edwards and Estes 2006). Therefore, although the 1997–98 ENSO may have generated more destructive waves (>3 m in height) than the 1982–83 ENSO, the 1982–83 ENSO had several extremely large (>8 m wave heights) wave events that appeared to be too large for giant kelp to survive. Waves of this magnitude simply were not observed during any of the other three ENSOs, and consequently giant kelp did not exhibit the levels of mortality that were observed during the 1982–83 ENSO.
While most studies on large-scale disturbances have focused on the disturbance impacts themselves, fewer have examined how populations recover from them, even though this would likely provide considerably more insight into what the full impacts of the disturbances are over longer time scales (e.g., Carleton and MacLellan 1994). Here, the four ENSOs differed substantially regarding to how giant kelp populations recovered following them, with substantial variability among locations within each geographic region. While this precluded making clear interpretations about the forcing factors responsible for driving regional differences, some clear generalizations were possible. Specifically, while the 1997–98 ENSO was followed by a period of cool La Niña conditions, which likely facilitated recovery of the giant kelp populations in both southern and Baja California, the 1982–83 ENSO was followed by a period of even warmer, more nutrient-poor ocean water, which further disturbed the giant kelp populations. As a result of the La Niña conditions post disturbance, giant kelp populations in southern California and at least some locations in Baja California recovered much more rapidly following the 1997–98 ENSO than the 1982–83 ENSO. Such differences were not discernable following the 1986–87 and 1991–92 ENSOs, likely because giant kelp mortality was much lower and recovery (i.e., recruitment of new giant kelp) largely still regulated by the availability of bottom light due to canopy shading (Graham et al. 1997). Indeed, biological interactions such as competition with subsurface kelps and grazing have been shown to be deterministic in how giant kelp recovers from these severe disturbances (e.g., Edwards and Hernández-Carmona 2005). Recovery at giant kelp’s southern range limit was delayed by almost two years following the 1997/98 ENSO due to limited propagule supply and competition with the stipitate kelp Ecklonia arborea (= Eisenia arborea) (Edwards and Hernández-Carmona 2005). This is in line with other studies that have found different species of kelp may exhibit different responses to ocean stressors, and this may impact their resiliency following distrbances(e.g., Lind and Konar 2017). Further, while the giant kelp ultimately returned to the southern range limit within 2–3 years after this ENSO, these populations disappeared from the location following the 1982–83 ENSO and remained absent for almost 20 years until after the 1997–98 ENSO. This was likely due, in part, to a combination of factors such as the impacts to Ecklonia (Eisenia) arborea populations and the fact that the 1997–98 ENSO was followed by La Nina conditions while the 1982–83 ENSO was followed by even more warmer waters. Recovery of giant kelp in central California was also more rapid following the 1997–98 ENSO than the 1982–83 ENSO, although this was likely due to the fact that the giant kelp populations were less impacted during the 1997–98 ENSO. Consequently, even though some ENSOs may exhibit similar impacts to giant kelp, they may differ markedly with regard to how the disturbed populations recover once the ENSOs end.
That ocean temperatures above 16°C and large ocean waves result in increased mortality to giant kelp during ENSOs is not a new, and in fact has been well known for several locations in these three regions (Dayton and Tegner 1984, 1990, Zimmerman and Robertson 1985, Tegner and Dayton 1987, Foster and Schiel 1992, Ladah and Zertuche-González 2004, Edwards and Hernández-Carmona 2005, Edwards and Estes 2006). However, that these factors interact at large spatial scales to drive regional patterns of giant kelp mortality, and that these patterns differ among ENSOs in a way that can be easily described but not previously been reported. Clearly, studies done at a few sites or points in time could easily misinterpret the nature and magnitude of these differences. Consequently, combining long-term monitoring data for several locations within this range, and for the important oceanographic forcing factors allowed for a clear comparison of these impacts, not only among regions but also among ENSOs and how these impacts differed among the different ENSOs. Unfortunately, several of these monitoring programs either ended, or the data became unavailable, precluding including the 2015 ENSO in the comparison. While new methods are becoming available for measuring giant kelp abundance (e.g., satellite imagery of the surface canopies) (Bell et al. 2015), these would need to be extended backward in time to estimate historic data. While this is possible, it would miss patterns of recovery of subsurface populations and their interactions with sub-canopy species, and thus it is beyond the focus of this paper. Indeed, new monitoring programs have been established since the late 1990’s that monitor kelp and subsurface algae at numerous locations along the west coast of North America (e.g., PISCO, http://www.piscoweb.org/kelp-forest-study; Reef Check, https://reefcheck.org/), but support is needed for maintaining these monitoring programs so that they can be used as benchmarks by which to compare future large-scale unpredictable disturbances.


