Isolation and characterization of two phototropins in the freshwater green alga, Spirogyra varians (Streptophyta, Zygnematales)
Article information
Abstract
Freshwater algae living in shallow waters have evolved various photomovement to stay in the optimum light condition for survival. Previous action-spectra investigations showed that Spirogyra filaments have phototropic movement in blue light. To decipher the genetic control of phototropic movement, two phototropin homologues were isolated from Spirogyra varians, and named SvphotA and SvphotB. Both phototropins have similar molecular structure consisted of two light–oxygen–voltage domains (LOV1, LOV2) and a serine/threonine kinase domain. SvphotA and SvphotB had 48.7% sequence identity. Phylogenetic analysis showed SvphotA and SvphotB belong to different clades suggesting early divergence, possibly before the divergence of land plants from the Zygnematales. Quantitative PCR and northern blot analysis showed that SvphotA and SvphotB responded differently to red and blue light. SvphotA was consistently expressed in the dark and in blue light, while SvphotB was expressed only when the plants were exposed to light. When the filaments were exposed to red light, SvphotA was significantly downregulated whereas SvphotB was highly upregulated. These results suggest that the two phototropins may have different roles in the photoresponse in S. varians.
INTRODUCTION
Plants have evolved various photomovement to protect themselves against excess energy in strong light and to optimize photosynthesis efficiency in low light (Banaś et al. 2012). There are four main families of photoreceptors in plants to perceive light: red/far-red-absorbing phytochromes, blue/UVA absorbing cryptochromes, Zeitlupe family proteins, and phototropins (Łabuz et al. 2012). In terrestrial angiosperms only the blue light receptor, phototropin, provides a fine-tuning mechanism by controlling rapid responses and transient movement (Suetsugu and Wada 2007). Phototropins are also involved in a wide range of light-dependent responses including phototropism, chloroplast movement, nuclear positioning and stomata opening (reviewed in Kami et al. 2010).
Higher plants have two different phototropins, phot1 and phot2, that are differentially regulated in chloroplast movement (Huala et al. 1997, Kasahara et al. 2002). Molecular characteristics of algal phototropins have also been reported (Huang et al. 2002). In the green alga Mougeotia scalaris, two phototropins, MsPHOTA and MsPHOTB, mediate blue-light-induced chloroplast movement (Suetsugu et al. 2005). Only a single phototropin was identified in both Volvox carteri and Chlamydomonas reinhardtii (Huang et al. 2002, Prochnik et al. 2010). The basic signal transduction mechanism is conserved in algal phototropins although they share only 30–40% sequence identity with higher plant phototropins (Kianianmomeni and Hallmann 2014). It has been shown that chloroplast movement was restored when the phototropin of Chlamydomonas was expressed in Arabidopsis phot1-phot2-deficient mutant (Onodera et al. 2005).
Expression profiles of phototropin genes differ considerably in various organs of higher plants (Ma et al. 2005). Arabidopsis phot1 and phot2 genes show different expression patterns in seedlings and mature leaves (Jarillo et al. 2001, Kagawa et al. 2001). The expression of phot1 and phot2 genes is affected by blue light (Kang et al. 2008), red light (Kagawa et al. 2001) and UVA (Jarillo et al. 2001) in different stages of etiolated seedlings. Similar expression changes were observed in rice phototropins (Jain et al. 2007). Light not only activates phototropins, but also affects the level of their expression. In Arabidopsis seedlings, phot1 is downregulated and phot2 is upregulated by light (Łabuz et al. 2012).
Previous action-spectra studies suggested that a blue-light photoreceptor is involved in Spirogyra filament movement with an optimum wavelength at 470 nm (Kim et al. 2005). In this study, we isolated and characterized two phototropin homologues involved in phototropic movement in Spirogyra varians.
MATERIALS AND METHODS
Plant material and inhibition experiment
Spirogyra varians was collected from a shallow pond in Kongju, Korea (36°20′34″ N, 127°12′28″ E). Collected samples were cleaned and cultured in DP11 medium (Klochkova et al. 2016) at 20°C under 20 μmol photons m−2 s−1 (12 L : 12 D). A phototropin inhibitor K-252a (Sigma, St. Louis, MO, USA) was used for inhibition experiments. A stock solution of K-252a (1 mM) was prepared using DMSO and stored at −20°C. Final concentration 0.1 μM was obtained by diluting the stock solution in DP11 medium. S. varians filaments were incubated with K-252a for 3 h then washed with DP11 medium at least three times for recovery of inhibition.
Observation of photomovement
To observe photomovement, S. varians filaments were fragmented into 5–10 cells pieces and observed in a micro-container (0.5 × 1.2 × 1.2 cm) placed on the stage of an inverted microscope with the monochromatic light sources placed at the side of stage. For the monochromatic light, an LED system with blue and red light was used. The LED system consisted of 400 diodes with a controller for maintaining the photoperiod and light intensity. Each LED diode emitted a narrow band of monochromatic light. Spectral distributions of blue (peak at 470 nm) and red (peak at 650 nm), were determined with a spectroradiometer (Li-1800; Li-COR, Lincoln, NE, USA) in the range of 300–1,100 nm as described previously (Kim et al. 2005). Photographs and videographs were taken using a time-lapse recorder fitted onto the inverted microscope.
DNA and RNA extraction and cDNA synthesis
Genomic DNA of S. varians was extracted using i-genomic Plant DNA mini kit (iNtRON Biotechnology Inc., Seongnam, Korea). Total RNA was isolated using an acid guanidium thiocyanate–phenol–chloroform extraction method (Han et al. 2012, 2015). Genomic DNA contamination was eliminated by on-column digestion with treatment of RNase-free DNase I using the RNeasy plant RNA extraction kit (QIAGEN, Hilden, Germany). The RNA concentration was determined spectrophotometrically and its integrity was assessed by 1.2% agarose-formaldehyde gel electrophoresis. First strand cDNAs were synthesized using Accuscript High Fidelity 1st strand cDNA kit (Agilent Technologies, Santa Clara, CA, USA) with random primers on a polymerase chain reaction (PCR) apparatus (Bio-Rad, Hercules, CA, USA) following the manufacturer’s protocol.
Cloning of Svphots and exon-intron structure analysis
Primers for the amplification of Svphot genes (Supplementary Table S1) were designed based on the partial phototropin sequences obtained from our S. varians transcriptome data in combination with previously reported algal phototropin sequences in NCBI Genbank (Han and Kim 2013). For the PCR amplifications and identifications, we used the cDNA library and AccuPrime Pfx SuperMix (Life Technologies, Grand Island, NY, USA). The PCR program was an initial denaturation at 95°C for 3 min, 35 cycles at 95°C for 30 s, 55°C for 30 s, and 68°C for 3 min, followed by 68°C for 10 min. The Svphots was identified by sequence analysis and cloned in TOPcloner TA cloning vector (Enzynomics, Daejeon, Korea). Genomic PCR was carried out to analyze intron arrangement in each phototropin gene. Full length sequences of SvphotA and SvphotB were registered in NCBI (accession No. MF422121, MF422122).
Phylogenetic analysis
Multiple align of sequences was performed among our Svphots and other phototropin genes from the NCBI database using MUSCLE (Edgar 2004) in Geneious (ver. 7.1.5, Biomatters, Auckland, NZ, USA). The conserved region from the light–oxygen–voltage (LOV) 2 domain to partial serine/threonine kinase domain was used for phylogenetic analysis. The tree was generated using these amino acid sequences with Bayesian phylogenetic analysis (MrBayes 3.2.6) (Huelsenbeck and Ronquist 2001) using a Blosum substitution model, 2,000,000 generations, subsampling frequency every 400 generations, and a burn-in length of 200,000 generations. Maximum likelihood analysis used RAxML 7.2.8 (Stamatakis 2014) using a WAG + gamma model with a method described previously (Diehl et al. 2017). Bootstrap support values (%) were calculated based on 1,000 bootstrap replicates. The Ostreococcus tauri PHOT gene was used as an outgroup. The sequences and their accession number in Genbank are given in Supplementary Table S2.
Quantitative PCR and northern blot analysis
Total RNA was extracted from S. varians over a time course incubation in various light conditions. cDNA was synthesized using the protocol described previously (Shim et al. 2016). Real-time PCR was performed using QuantiSpeed SYBR Hi-Rox Kit (PhileKorea, Daejeon, Korea) in a StepOnePlus Real-Time PCR System (Applied Biosystems, Foster City, CA, USA). cDNA samples were amplified in triplicate from the same RNA preparation. The final reaction volume was 50 μL and included 10 μL of diluted cDNA, 25 μL of QuantiSpeed SYBR Hi-Rox mix and 500 nM of each primer. The primers used for quantitative PCR (qPCR) are shown in Supplementary Table S1. The reaction protocol was set first on 95°C for 5 min and then 40 cycles of 95°C for 15 s, and 60°C for 20 s. Expression levels were then calculated against the house-keeping gene GAPDH as a calibrator using the delta-delta Ct method (Livak and Schmittgen 2001). qPCR result was confirmed using northern blot analysis. The primers used for probes are shown in Supplementary Table S1. The DNA probe was directly amplified and labeled with DIG-dUTP by PCR of the Svphot genes from S. varians first strand cDNA using the DIG probe Synthesis Kit (Roche Diagnostics, Berlin, Germany). Northern blot was performed as described previously (Han and Kim 2013).
RESULTS
When fragments of S. varians filaments were exposed to unilateral blue light each distal end of the filament began to curve towards the light in 1 h (Fig. 1A). A phototropin inhibitor, K-252a, blocked this movement, but the movement was recovered as soon as the inhibitor was washed out (Fig. 1B). Full-length cDNA sequences of two phototropin homologues of S. varians were obtained and named SvphotA and SvphotB (Fig. 2). Two phototropins had well conserved LOV1, LOV2 and serine/threonine kinase domains (Fig. 2A), although the sizes were smaller than those of higher plants. The protein structure of SvphotA and SvphotB was different, especially in the serine/threonine kinase domain (Fig. 2B). The two phototropins showed quite low sequence similarity (48.7% in amino acid sequence and 54.2% in cDNA sequence), but the number of introns were the same (Fig. 2A). The genomic structure of SvphotA and SvphotB comprised 21 exons and 20 introns (Fig. 2A). When we compared the positions of introns in each gene the exon-intron structures were identical between SvphotA and SvphotB (Fig. 2A).
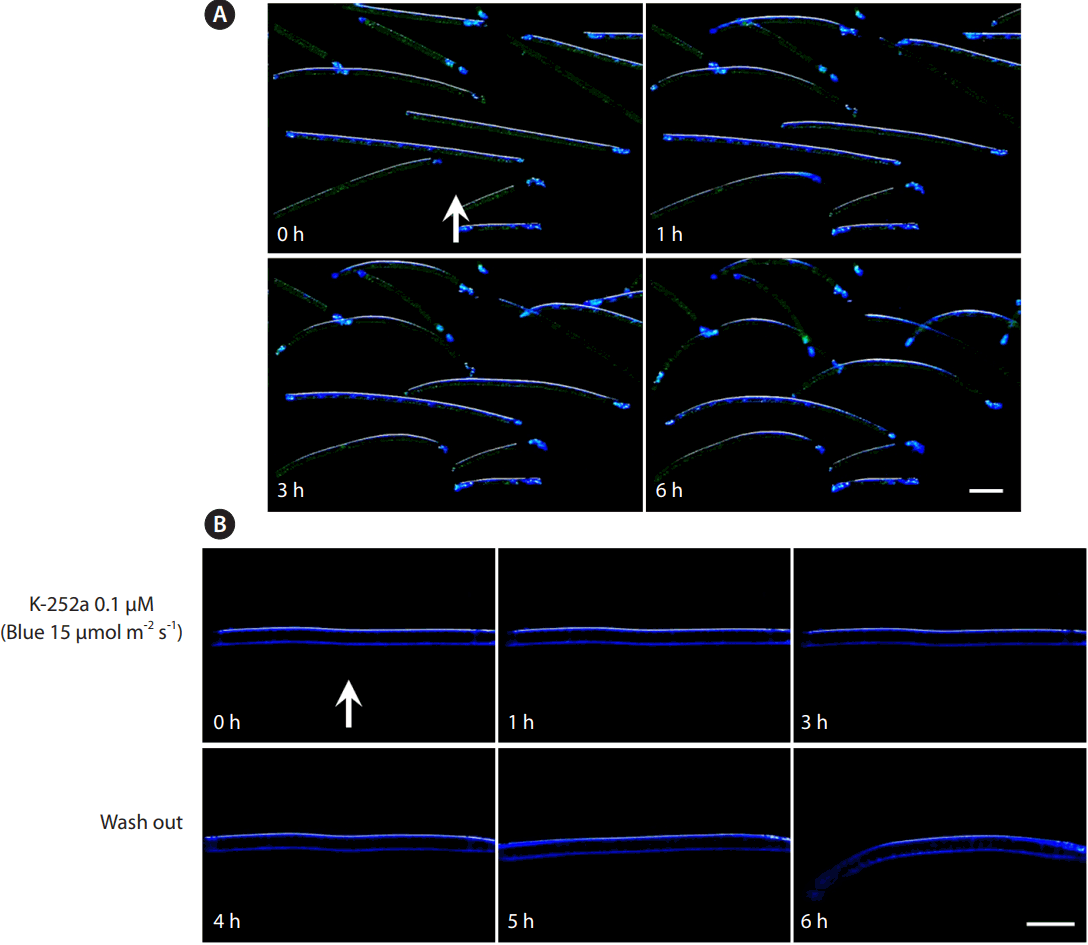
Phototropic movement in Spirogyra varians. (A) Distal ends of the fragmented filaments curve towards light direction. (B) Inhibition of phototropic movement with K-252a treatment. Filaments began to curve towards light after wash out. White arrows indicate direction of light. Scale bars represent: A, 150 μm; B, 100 μm.

Secondary structure of Spirogyra varians phototropins. (A) SvphotA and SvphotB have different sequence lengths, but the number and order of introns are the same. Introns whose positions are equivalent in each gene are connected with thin lines. (B) Amino acid sequences were well conserved in light–oxygen–voltage domains (LOVs) and kinase domains.
When the sequences of LOV1 and LOV2 domains were compared with other organisms, SvphotA showed higher sequence identity than SvphotB to the genes compared (Table 1). All flavin mononucleotide (FMN) and FMN-interacting sites in the LOV1 and LOV2 domains are well conserved in SvphotA and SvphotB (Fig. 3). Phylogenetic analysis showed that SvphotA and SvphotB belonged to distantly related subclades. SvphotA nested within the Charophyte lineage, while SvphotB was sister to the charophytes and land plants, but with poor support (Fig. 4).
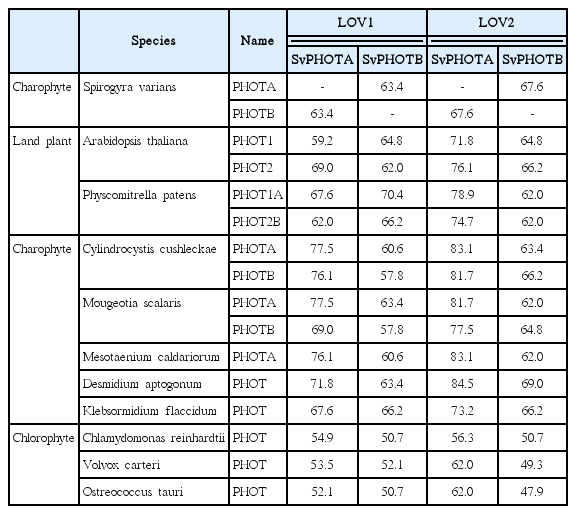
Amino acid sequence % identity of LOV domains among chosen phototropin genes in algae and higher plants
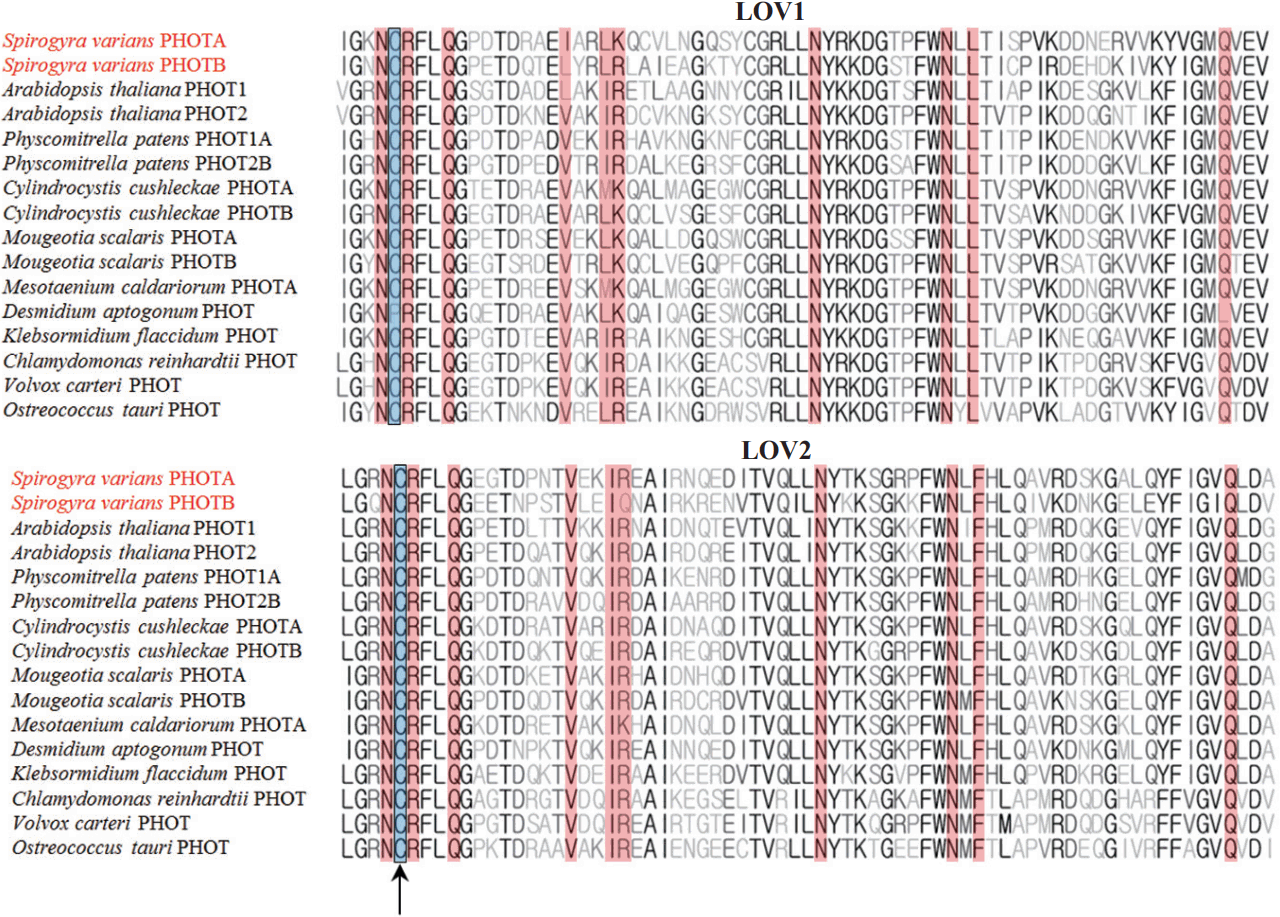
Alignment of light–oxygen–voltage (LOV) 1 and LOV2 domains of phototropins isolated from plants and algae. All flavin mononucleotide (FMN) and FMN-interacting sites are well conserved in SvphotA and SvphotB. The site for FMN adduct formation is marked by an arrow, and the FMN-interacting sites are shown in red.
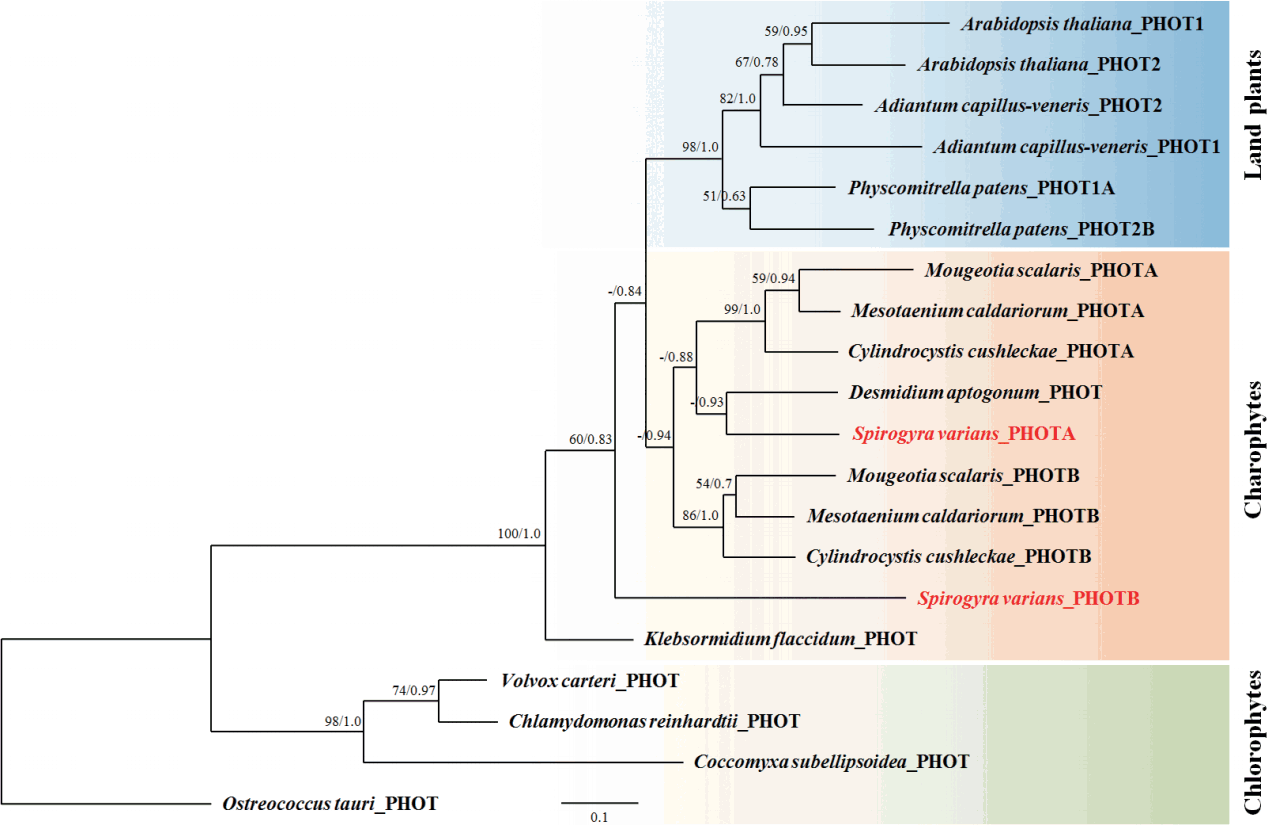
Phylogenetic tree of phototropins from Spirogyra varians and other plant and algae. A majority consensus phylogeny of 20 phototropins from green algae and land plants was reconstructed by Bayesian inference analysis of an alignment of amino acid sequences (Supplementary Fig. S1). The Ostreococcus tauri PHOT sequence was used as the outgroup. Posterior probabilities are indicated at the nodes. RAxML bootstrap percentages and posterior probabilities are indicated at the nodes. Bootstrap percentage values <50% are not shown.
Two phototropins of S. varians responded differently to blue and red light (Fig. 5). SvphotA was consistently expressed in blue light, but was dramatically downregulated in red light. When filaments were transferred to dark condition, the expression of SvphotA was rapidly recovered (Fig. 5A). SvphotB was expressed only when the filaments were exposed to light. The expression reached a peak in 3 h after light exposure, and gradually reduced over the time course (Fig. 5B). Red light also induced upregulation of SvphotB although blue light induced greater expression (Fig. 5B). Northern blot analysis showed similar results. A significant amount of SvphotA was expressed consistently regardless of light condition, while SvphotB transcript was much weaker and higher levels seen transiently after exposure to light (Supplementary Fig. S2).
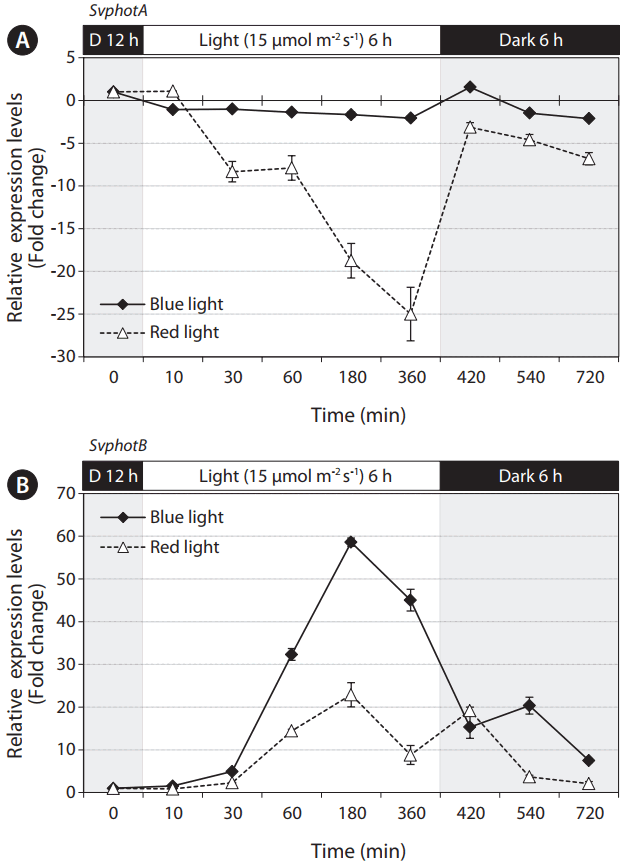
Quantitative polymerase chain reaction results of SvphotA and SvphotB expression in blue and red light after 12 h preincubation in dark. (A) SvphotA expression did not change in blue light and dark, but was significantly reduced in red light. The reduced expression in red light was recovered as soon as the filaments were moved to the dark. (B) SvphotB expression significantly increased after the filaments were exposed to both blue and red light. SvphotB expression was greater in blue light.
DISCUSSION
Light is an important environmental cue, and photoreceptors play a pivotal role in controlling light-dependent movement. The filament movement in Spirogyra has been observed for more than a century (Hofmeister 1874), but the photoreceptors are characterized for the first time in this study. Our inhibition experiments indicated the involvement of phototropins in blue-light movement. Phylogenetic analyses showed two different phototrophins in S. varians, SvphotA is closely related to phototropins from other zygnematalecean algae, while SvphotB is more distantly related, and could be due to a duplication before the split of land plants and zygnematalecean algae. The two phototropins from S. varians showed different expression patterns suggesting that SvphotA and SvphotB may have different roles in photomovement of S. varians.
Our inhibition experiment using K-252a showed that phototropic movement in S. varians is mediated by phototropins. K-252a is an alkaloid isolated from a soil fungus which has been used to block phototropin-mediated response in higher plant as it suppresses phosphorylation of phototropin by inhibiting its serine/threonine kinase domain (Inoue et al. 2005). Although it is possible that K-252a may affect some other kinase activity which results in inhibition of movement, phototropin is still the most probable candidate that mediates phototropic movement in Spirogyra. Another blue-light photoreceptor, cryptochrome, does not have a kinase domain, and is not blocked with K-252a treatment. Two chromophores in cryptochromes have different absorption wavelength; pterin at 380 nm and flavin (in the form of FAD) at 450 nm (Song et al. 2006, Hoang et al. 2008). Previous action spectra studies showed that phototropic movement in Spirogyra did not occur in UV light and the optimum wavelength of phototropic movement was 470 nm, which is higher than that of cryptochromes (Kim et al. 2005). These results support our hypothesis that the phototropins isolated in this study mediate phototropic movement in S. varians.
Phototropic movement in Spirogyra is different from higher plant because the movement is unsteady and often interrupted by other movements such as gliding movement or gravitational movement (Kim et al. 2005). The phototropic movement of Spirogyra was first reported by Tanaka et al. (1986). They reported that phototropic movement occurred only at certain times of the day, and the movement might be relatively inferior to gravitational movements because a typical and steady phototropic curvature was not observed in Spirogyra (Ojima and Tanaka 1970, Tanaka et al. 1986). In a previous study, we showed that there is no diurnal rhythm in the photomovement of Spirogyra, and confirmed that mucilage secretion is not the cause of movement (Kim et al. 2005). Further studies on the downstream signaling of these phototropins are necessary to understand how these genes regulate the movement.
The two phototropins in S. varians shared low sequence similarity compared to phototropin isoforms in higher plants and other freshwater algae. Higher plants have two phototropins, phot1 and phot2, which are differentially regulated in many cellular processes (Huala et al. 1997, Kasahara et al. 2002). Phototropins are unique to Viridiplantae, and this gene family expanded through duplication within various land plant lineages (Li et al. 2015). Algal phototropins are also involved in various cellular processes, but little is known for their isoforms (Kianianmomeni and Hallmann 2014). The two phototropins in S. varians may regulate phototropic movement differentially like phot1 and phot2 in higher plants. It is also possible that SvphotA and SvphotB are involved in different cellular events.
The phylogeny of SvphotA and SvphotB is interesting. Existing functional data for phototropins, suggest a history of repeated gene duplications followed by parallel functional divergences (Li et al. 2015). Phylogenetic analysis between phototropins in Mougeotia scalaris isoforms (Li et al. 2015) suggested a close phylogenetic relationship, and both mediate blue-light-induced chloroplast movement (Suetsugu et al. 2005). It has been shown that algal phototropins can substitute higher plant phototropins when they were expressed in phototropin-deficient mutant although they share only 30–40% of sequence identity with higher plant phototropins (Onodera et al. 2005, Kianianmomeni and Hallmann 2014). The relationship between SvphotA and SvphotB implies that the two phototropins diverged early in Streptophyte history and therefore they may be functionally divergent.
Our data showed that the intron structure is highly conserved between SvphotA and SvphotB. The positions of equivalent 20 introns in each gene were identical in two phototropins. Intron shuffling is common in phototropins of same species (Kagawa et al. 2004). It has been proposed that intron shuffling contributed to functional divergence of photoreceptors such as neochrome in Mougeotia (Suetsugu et al. 2005). The conserved exon-intron structure in SvphotA and SvphotB is rarely seen in any other groups of phototropins.
What is the other function of phototropins in Spirogyra? Phototropin in Chlamydomonas reinhardtii regulates multiple steps in sexual reproduction (Huang and Beck 2003). Overexpression of phototropin in C. reinhardtii altered the sensitivity of chemotaxis during sexual differentiation (Ermilova et al. 2004). Phototropin is also involved in photosynthesis in C. reinhardtii by regulating transcription of genes encoding enzymes responsible for chlorophyll and carotenoid biosynthesis (Im et al. 2006). It is possible that phototropic movement may enhance conjugation chance in Spirogyra because the filaments will align parallel to each other during this movement.
Many questions still remain on the role of these isoforms of phototropin in S. varians. What are the signal transduction pathways of phototropin action? What are the mechanical effectors for the movement? And what are the components of the downstream signaling pathways? Functional genomic studies using model expression systems will help to answer some of the above questions.
SUPPLEMENTARY MATERIALS
Supplementary Table S1. List of primers used in this study (http://www.e-algae.org).
Supplementary Table S2. Genbank accession number of sequences of phototropin used for phylogenetic analyses (http://www.e-algae.org).
Supplementary Fig. S1. Alignment of phototropin amino acid sequences used in phylogenetic analysis (http://www.e-algae.org).
Supplementary Fig. S2. Northern blot analysis on expression of SvphotA and SvphotB in blue (A) and red (B) light. The filaments were pre-incubated in the dark for 12 h prior to exposure to red and blue light (http://www.e-algae.org).
ACKNOWLEDGEMENTS
This research was supported by Korea Institute of Planning and Evaluation for Technology in Food, Agriculture, Forestry and Fisheries (IPET) through Golden Seed Project, funded by Ministry of Agriculture, Food and Rural Affairs (MAFRA) (213008-05-1-SB810), Ministry of Oceans and Fisheries (MOF) and also sponsored by National Research Foundation of Korea Grant (NRF-2015M1A5A1041804) funded to GHK.