Ecklonia cava (Laminariales) and Sargassum horneri (Fucales) synergistically inhibit the lipopolysaccharide-induced inflammation via blocking NF-κB and MAPK pathways
Article information
Abstract
Ecklonia cava (EC) has been widely utilized as an ingredient in commercial products such as functional foods and cosmeceuticals. Recently it has been found that Sargassum horneri (SH) has been invading on Jeju Island coast area by its huge blooming. Moreover, both seaweeds are considering as important ingredients in traditional medicine specifically in East-Asian countries (China, Japan, and Korea). In the present study, we attempted to compare anti-inflammatory properties of 70% ethanolic extracts of EC (ECE), SH (SHE), and their different combinations on lipopolysaccharide (LPS)-activated RAW 264.7 cells. Results indicated that 8 : 2 combinations of ECE : SHE significantly inhibited LPS-activated inflammatory responses (cytokines, protein, and gene expression) in RAW 264.7 macrophage cells compared to the respective extracts and other combinations. The synergistic effect of ECE and SHE was found to be prominent than the effects of ECE or SHE alone. These observations provide useful information for the industrial formulation of functional materials (functional foods and cosmeceuticals) using these two particular seaweeds in Jeju Island of South Korea.
INTRODUCTION
Inflammation is an innate immune response to eliminate the infections from foreign pathogens, to initiate tissue wound healing, and / or reduce the effects of toxin exposure. Inflammatory responses are usually linked with the immune cells such as mast cells and monocytes which are responsible for altered levels of inflammation-associated enzymes, pro-inflammatory cytokines, and inflammation associated secondary mediators. During the inflammatory responses macrophages secrete defense molecules to eliminate immunostimulants and to induce the production of inflammatory mediators such as nitric oxide (NO), prostaglandin E2 (PGE2), interleukin 1β (IL-1β), IL-6, and tumor necrosis factor-α (TNF-α) (Lee et al. 2016, Seo et al. 2016). NO and PGE2 molecules are act as key inflammatory mediators, which are bio-synthesized by the inducible nitric oxide synthase (iNOS) and cyclooxygenase-2 (COX-2), respectively (Seo et al. 2016). It has been reported that, pro-inflammatory cytokines and inflammation related proteins such as iNOS and COX-2 produced by macrophages play an important role during the inflammatory responses. Previously, a number of studies reported that the up-regulated expression of pro-inflammatory cytokines are responsible for the activation of inflammation-associated signaling cascades like mitogen-activated protein kinase (MAPK) and nuclear factor-κB (NF-κB) signal transduction pathway (Seo et al. 2016, Sanjeewa et al. 2017). Activation of these signaling pathways are useful for pathogen removal from infected sites and speed up the recovery process. However, studies also have demonstrated, the excessive and un-controlled production of inflammatory mediators are linked to the pathogenesis of inflammation-associated diseases such as autoimmune diseases and cancers (Takeuchi 2016). Thus, the inflammation-associated diseases have become leading causes of healthcare issue all around the world and which having a considerable impact on healthcare costs (Fernando et al. 2016). Therefore, inhibition of the inflammatory responses is a key objective for the development of anti-inflammatory drugs to treat inflammation-associated diseases.
Since the ancient time’s seaweeds have gained much interest as a source of healthy nutrients and as a source of medicine (folk medicine) especially, in the Far East countries (Liu et al. 2012, Chang et al. 2016). Additionally, some studies also revealed the secondary metabolites presence in seaweeds have potential anti-inflammatory properties under different conditions (Wen et al. 2016, Sanjeewa et al. 2017). Among brown seaweeds, Ecklonia cava (EC) is a popular edible brown seaweed growing along the coasts of Korea, Japan, and China. Bioactive compounds and crude extracts separated from EC owing a range of health promoting properties including anti-inflammatory activities (Choi et al. 2017). In contrast to EC, Sargassum horneri (SH) also a popular edible brown seaweed in Korea, China, and Japan due to the interesting health promoting effects associated with SH (Sanjeewa et al. 2017, Kim et al. 2018). According to the previous studies, both seaweed species are rich in anti-inflammatory compounds. Especially, phlorotannins separated from EC (2,7-phloroglucinol-6, phloroglucinol, eckol, pyrogallol-phloroglucinol-6,6-bieckol, dieckol, and 6-bieckol), and sulfated polysaccharides and crude extracts separated from SH found to possess promising anti-inflammatory effects under in vitro and in vivo conditions (Lee et al. 2014b, Kim et al. 2015, Sanjeewa et al. 2017). Moreover, both seaweeds are considering as important, medicinal ingredient in traditional medicine specifically in the East-Asian countries like China, Korea, and Japan (Nisizawa 1979, Chengkui et al. 1984).
In the industries like functional foods and cosmeceuticals, these seaweeds are not used as a single ingredient. During the production, seaweeds are mix with other ingredients in different ratios. Thus, the prospective effects of these mixtures are might change with the seaweed species and the amount used in the formulation. Therefore, it is urge to optimize the formulation of functional products based on seaweeds in their composition (Roohinejad et al. 2017). Until now there are no studies reported about anti-inflammatory effects of EC and SH different ratios treated to lipopolysaccharide (LPS)-activated RAW 264.7 cells. Taken together, in the current study we attempted to study anti-inflammatory effects of different EC and SH (70% ethanolic extracts) ratios on LPS-activated RAW 264.7 cells. The content in this report might be useful to formulate more effective functional foods, cosmeceuticals, and / or nutraceuticals products.
MATERIALS AND METHODS
Sample collection
EC and SH collected from May to June 2015 along the shores of Jeju, Korea. The identity of collected seaweed samples was confirmed by Jeju Biodiversity Research Institute (Jeju, Korea).
Chemicals and regents
The murine macrophage-like cell line RAW 264.7 was purchased from Korean Cell Line Bank (Seoul, Korea). Fetal bovine serum (FBS), Dulbecco’s modified Eagle’s medium (DMEM), and penicillin-streptomycin were purchased from Gibco BRL (Burlington, Canada). Dimethyl sulfoxide (DMSO), Tri-Reagent, and 3-(4,5-dimethylthiazol-2-yl)-2,5-diphenyltetrazolium bromide (MTT) were purchased from Sigma-Aldrich (St. Louis, MO, USA). Enzyme-linked immunosorbent assay (ELISA) kit for PGE2 was acquired from R&D Systems Inc. (Minneapolis, MN, USA). Rabbit polyclonal antibodies (iNOS, p50, p65, ERK, p-ERK, JNK, p-JNK, p38, and p-p38) and mouse monoclonal antibodies (COX-2 and β-actin) were purchased from Cell Signaling Technology (Beverly, MA, USA). Pierce BCA Protein Assay Kit was purchased from Thermo Scientific (Rockford, IL, USA).
Seaweed extraction
The freeze-dried seaweed samples (20 g) were crushed into a fine powder and subsequently extracted with 70% ethanol (2 L) for 24 h at room temperature using shaking incubator (100 rpm). This step was repeated three times and then ethanol soluble fraction was vacuum filtered using Whatman No. 4 filter papers (Whatman, Kent, UK). The ethanol soluble fraction was concentrated using rotary evaporator and then freeze-dry to collect solvents free seaweed extracts. The freeze-dried ethanolic extracts of E. cava (ECE) and S. horneri (SHE) were dissolved in DMSO and the final concentration of DMSO in control or seaweed extract treatment not surpass the 0.05%.
Analysis of chemical composition
The ash content of the seaweed samples was obtained by dry ashing in a furnace for 6 h at 550°C (Horwitz and Latimer 1990). Crude protein contents of seaweeds were analyzed by calculating the conversion factor of 6.25. The crude lipid content of seaweed samples were quantified using soxhlet method with di-ethyl ether solvent (Chandler and Dodds 1983). The polysaccharide content of the ethanolic extracts quantified using phenol-sulfuric acid method as mentioned by DuBois et al. (1956). Glucose used as the calibration standard. The phenol content of the extracts was quantified using a method described by Chandler and Dodds (1983) and gallic acid used as the calibrative standard. The protein content of the extracts was calculated using a commercial protein quantification kit, according to the vendor’s specifications. Bovine serum albumin used as the standard.
Cell culture
RAW 264.7 macrophages were cultured in DMEM complemented with 10% heat-inactivated FBS, 1% penicillin-streptomycin. Cultured cells were incubated at 37°C with 5% CO2 and cells from passages 4–6 were used for the subsequent studies.
Measurement of cell viability
The cytotoxic effect of seaweed extracts on macrophages were evaluated using the MTT assay as documented by Mosmann (Mosmann 1983), with minor changes. Cells cultured in 48-well plates (1 × 10⁵ cells mL−1) and incubated for 24 h. Then, RAW 264.7 cells were treated with seaweed extracts and their combinations (15.6–250 μg mL−1) for 24 h. Then, MTT was added (200 μg per well) to each well. After 2 h of incubation, the formazan crystals were resolved in DMSO, and quantified spectrophotometrically at 540 nm (BioTek Instruments, Winooski, VT, USA). The absorbance value in untreated control cells was considered to represent 100% cell viability. The results expressed as a mean percentage value of MTT reduction of treated cells relative to control cells.
Evaluation of NO inhibition
To determine the effects of seaweed extracts and / or their combinations on NO production in LPS-induced RAW 264.7 cells, authors performed Griess assay with a method described by Leiro et al. (2002) with trivial modifications. Briefly, RAW 264.7 cells were seeded in 24-well cell culture plates (1 × 10⁵ cells mL−1) and incubated for 24 h. After 24 h RAW 264.7 cells were treated with extracts (15.6–250 μg mL−1) and / or their combinations (62.5–125 μg mL−1) for 1 h. Then stimulated with LPS (1 μg mL−1) and incubated for another 24 h. Then, 50 μL of the culture supernatants and Griess reagent were mixed in a 96-well plate and after 10 min the optical density was quantified using an ELISA plate reader (540 nm). The optical density of only LPS-stimulated cells was considered to represent 100% NO production. All results expressed as mean percentages value of NO production versus NO production of only LPS-activated RAW 264.7 cells.
Evaluation of PGE2 production
PGE2 levels in the cell culture supernatant were quantified using an immune-enzymatic method according to the vendor’s specifications.
Western blotting for inflammatory protein expression
RAW 264.7 cells were seeded in 6-well plates (1 × 10⁵ cells mL−1) and allowed to adhere for 24 h. Then RAW 264.7 macrophages treated with seaweed extracts alone or their combinations (62.5 μg mL−1) for another 1 h and then exposed to LPS (1 μg mL−1). After 24 h cytosolic proteins were extracted using a commercial protein extraction kit purchased from Thermo Scientific. Extracted proteins were separated using 10% sodium dodecyl sulfate polyacrylamide gel electrophoresis separation. Forty micrograms of cytoplasmic proteins electrotransferred onto a nitrocellulose membrane. Then blocked with 5% nonfat milk and after 1 h nitrocellulose membranes were separately incubated with the primary antibody for 1 h. Then, washed two times with Tween 20 / Tris-buffered saline and again incubated with horseradish peroxidase-conjugated anti-mouse or anti-rabbit IgG for another 45 min. Bands were visualized by using enhanced chemiluminescence reagents (Amersham, Arlington Heights, USA). The expression levels were quantified by densitometric analysis using the ImageJ 1.49v (National Institutes of Health, Bethesda, MD, USA).
Total RNA extraction and cDNA synthesis
Total cellular RNA was extracted using Tri-Reagent according to the vendor’s instructions. The concentration and purity of the isolated RNA samples were measured using a μ Drop Plate (Thermo Scientific). Then, RNA samples were diluted in to 1 μg μL−1 concentration and first strand cDNA was prepared using Prime Script first-strand cDNA synthesis kit (TaKaRa, Tokyo, Japan). The cDNA was diluted 40 times and stored at −80°C.
Quantitative real-time polymerase chain reaction analysis
Expression levels of pro-inflammatory cytokines were evaluated using SYBR Green quantitative real-time polymerase chain reaction (qPCR) method using Thermal Cycler Dice-Real Time System (TaKaRa). Glyceraldehyde 3-phosphate dehydrogenase (GAPDH) was used in amplification as reference gene. The primers (Bioneer, Seoul, Korea) used in this study were shown in Table 1. Reactions were carried out in a 10 μL volume, which contained 3 μL diluted cDNA template, 5 μL of 2× TaKaRa ExTaq SYBR premix solution, 0.4 μL each of the reverse and forward primers (10 μM), and 1.2 μL ddH2O. Briefly, the reaction was performed using the following profile: one cycle at 95°C for 10 s, 40 cycles at 95°C for 5 s, 55°C for 10 s, and 72°C for 20 s, and a final single cycle at 95°C for 15 s, 55°C for 30 s, and 95°C for 15 s. Assays were conducted in triplicate. The relative gene expression levels were analyzed by the 2−ΔΔCT method (Livak and Schmittgen 2001). The baseline was automatically set by Dice Real-Time System software (2.00 V) to maintain consistency of results. The data are presented as the mean ± standard error (SE) of the relative mRNA expression from 3 consecutive studies. The two tailed unpaired students t-test was used to determine the significance of gene expression levels.

Sequence of the primers used in this study
Statistical analysis
All experiments were repeated at least three times in triplicate. All results were expressed as the mean ± SE. Multiple group comparisons were performed using one-way ANOVA followed by Duncan’s multiple range test -hoc test using the SPSS ver. 20 statistical analysis package (IBM Corp., Armonk, NY, USA).
RESULTS
Extraction yield and general components
In the present study, authors extracted SH and EC using 70% ethanol solution. According to the extraction yield, SH showed higher extraction yield than E. cava extract. However, phlorotannins content of ECE was 18.09 mg gallic acid equivalent (GAE) g−1 which was two times higher than phlorotannins observed in SHE (7.85 mg GAE g−1). Polysaccharide composition of SHE and ECE were ranged between 10.67 and 24.28 g 100 g−1. Additionally, ECE contained 7.5 g 100 g−1 protein and SHE contained 6.5 g 100 g−1. Yield percentage, moisture content, and the ash content of seaweeds and proximate chemical composition of the 70% ethanolic extracts of seaweeds are summarized in Table 2.
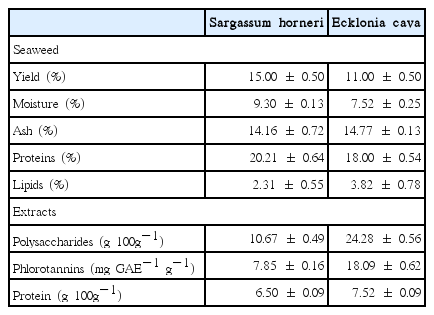
Yield percentage, moisture content, ash content of seaweeds, and proximate chemical composition of their 70% ethanolic extracts
Effect of ECE and SHE on NO secretion in LPS-activated RAW 264.7 cells
We performed Griess assay to investigate NO inhibitory effect of ECE and SHE on LPS-activated RAW 264.7 cells. Cell viability results revealed, the concentrations higher than 500 μg mL−1 had strong cytotoxic effect on RAW 264.7 cells (data not shown). However, concentrations lower than the 500 μg mL−1 were not showed any significant cytotoxic effect on RAW 264.7 macrophages compared to the control (Fig. 1A & B). Specifically, in the present study, we noted, the concentrations starting from 15.6 to 250 μg mL−1 has a potential to inhibit LPS-induced NO production from RAW 264.7 macrophages (Fig. 1C & D).
Cytoprotective effects of 70% ethanolic extracts on RAW 264.7 cells in the presence of lipopolysaccharide (LPS) (A & B). The cells without LPS and samples considered as a reference (100%). Nitric oxide (NO) inhibitory effect of 70% ethanolic extracts on LPS-stimulated RAW 264.7 macrophages (C & D). The level of NO production is expressed as percentages of that of the group treated with LPS alone. ECE, ethanolic extracts of Ecklonia cava; SHE, ethanolic extracts of Sargassum horneri. Data points and bars represent the arithmetic means ± standard deviation (n = 3). *p < 0.05 and **p < 0.01 compared to LPS treated group or ##p < 0.01 vs. control group by Duncan’s multiple range test.
NO inhibitory effects of ECE and SHE different ratios treated to LPS-activated RAW 264.7 macrophages
The 62.5 and 125 μg mL−1 concentrations were selected for further studies as those concentrations had the lowest cytotoxicity and good NO inhibition properties toward LPS-activated RAW 264.7 macrophages. Different amounts of ECE and SHE mixed together (ECE : SHE; 0 : 10, 2 : 8, 4 : 6, 5 : 5, 6 : 4, 8 : 2, 10 : 0) to evaluate anti-inflammatory effect of mixed samples (five combinations). The combined extracts were incubated with RAW 264.7 macrophages for 1 h and then activated using LPS for another 24 h. Then evaluate NO inhibitory effect of each combination. According to the results, combinations of ECE and SHE inhibited the NO production from LPS-exposed RAW 264.7 cells than the single extracts without showing any cytotoxic effect (Fig. 2A). Moreover, all five combinations inhibited LPS-activated NO production from RAW 264.7 cells. Specifically, among the tested concentrations 5 : 5 and 8 : 2 combination showed highest NO inhibition compared to the other combinations (Fig. 2B).

Cytoprotective effects of alone and mixed Ecklonia cava and Sargassum horneri extracts (ECE and SHE) on lipopolysaccharide (LPS)-stimulated RAW 264.7 cells. RAW 264.7 cells without LPS and samples were considered as a reference (100%) (A). Nitric oxide (NO) inhibitory effect of single and combined ECE and SHE on LPS-stimulated RAW 264.7 macrophages (B). The level of NO production expressed as percentages of that of the group treated with LPS alone. The prostaglandin E2 (PGE2) inhibitory effects of the alone and mixed ECE and SHE on LPS-stimulated RAW 264.7 cells (C). RAW 264.7 cells (1 × 10⁵) stimulated with LPS (1 μg mL−1) for 24 h with or without extracts. Supernatants collected and levels of PGE2 in the culture supernatant determined by enzyme-linked immunosorbent assay according to the manufacturer’s instructions. Data points and bars represent the arithmetic means ± standard deviation (n = 3). *p < 0.05 and **p < 0.01 compared to LPS treated group or ##p < 0.01 vs. control group by paired sample t-test.
PGE2 inhibitory properties of seaweed extracts on LPS-activated RAW 264.7 cells
A number of studies revealed the inter-connection between the excessive production of PGE2 and healthcare problems such as pathogenesis of chronic inflammatory diseases and cancers (Nakanishi and Rosenberg 2013). According to the results, ECE and SHE treated RAW 264.7 macrophages had significantly low PGE2 secretion than the LPS-activated RAW 264.7 cells. Moreover, the combinations of ECE and SHE either 5 : 5 or 8 : 2 had a more suppressive effect on PGE2 secretion from LPS-stimulated RAW 264.7 cells than the single extracts (Fig. 2C).
iNOS and COX-2 inhibitory effect of seaweed extracts on LPS-activated RAW 264.7 cells
To understand whether NO and PGE2 inhibitory effect of ECE, SHE, and their combinations related to modulation of iNOS and COX-2 expression, authors examined the iNOS and COX-2 protein expression levels using western blots. In response to LPS, iNOS and COX-2 protein levels were significantly increased. However, treatment of ECE, SHE, and their combinations to macrophages before LPS-stimulation was found to inhibit the up-regulated iNOS and COX-2 production from activated macrophages cells. However, 8 : 2 combination inhibited the up-regulated iNOS and COX-2 production from activated macrophages than the 5 : 5 combination (Fig. 3A & B).
Western blots of inducible nitric oxide synthase (iNOS) and cyclooxygenase-2 (COX-2) protein expression in lipopolysaccharide (LPS)-induced RAW 264.7 cells with or without Ecklonia cava and Sargassum horneri extracts (ECE and SHE) or their combinations (A). Densitometry analysis of the relative level of iNOS and COX-2 compared to β-actin (B). ImageJ software used to determine the intensity of bands. RAW 264.7 cells were pretreated with different concentrations and combinations of seaweed extracts for 1 h and then incubated with LPS for 24 h. After 24 h cell lysates (40 μg) were resolved by 10% sodium dodecyl sulfate polyacrylamide gel electrophoresis, transferred to nitrocellulose membranes, and probed with antibodies against iNOS, COX-2, and β-actin to determine expression levels of inflammatory proteins. Data points and bars represent the arithmetic means ± standard deviation (n = 3). *p < 0.05, **p < 0.01.
ECE, SHE, and their combinations attenuates LPS-stimulated pro-inflammatory gene expression
qPCR was used to determine the where the inhibitory effect observed on pro-inflammatory cytokines by ECE, SHE, and their combinations were due to the inhibition of mRNA expression. In response to LPS all tested mRNA expression levels were significantly up-regulated (Fig. 4A–C) compared to the control group as expected. However, pre-incubation of ECE, SHE, and their combinations with RAW 264.7 macrophages before the LPS-stimulation; significantly and dose-dependently inhibited the up-regulated pro-inflammatory mRNA expression levels. By contrast, the combinations of ECE and SHE inhibited increased mRNA expression levels than ECE and SHE single extracts. According to mRNA expression profiles, it is clear that the combinations of ECE and SHE more effective than the single extracts. In the present study, we observed the expression ratios of IL-1β and IL-6 on LPS-stimulated group was 5,936 and 31, respectively.
Effects of Ecklonia cava (ethanolic extracts of Ecklonia cava, ECE), and Sargassum horneri (ethanolic extracts of Sargassum horneri, SHE) extracts and their combinations on lipopolysaccharide (LPS)-induced interleukin (IL)-1β (A), IL-6 (B), and tumor necrosis factor α (TNF-α) (C) production and on their mRNA expressions in RAW 264.7 cells. Total RNA prepared from cells pretreated with / without the indicated concentrations of ECE, SHE, and their combinations for 1 h and then stimulated with LPS (1 μg mL−1) for 6 h. Total RNA harvested and used for quantitative real-time polymerase chain reaction performed with pre-designed primers and probes for the indicated target genes and to the housekeeping glyceraldehyde 3-phosphate dehydrogenase (GAPDH) using TaqMan reagents. The results were analyzed by the delta-Ct method and expression of target genes was normalized to GAPDH expression. Control was obtained in the absence of LPS and seaweed extracts. The values shown are the means ± standard deviations (n = 3). **p < 0.01 vs. the LPS-treated group or ##p < 0.01 vs control group.
Effect of combine treatment on NF-κB and MAPK protein expressions
Among the tested combinations 8 : 2 (125 μg mL−1) had more anti-inflammatory effect on LPS-activated RAW 264.7 macrophages (NO, iNOS, COX-2, PGE2, and pro-inflammatory gene expressions) than the other tested combinations. Therefore, we further evaluated NF-κB and MAPK associated protein expression levels of 8 : 2 combinations against LPS-activated RAW 264.7 macrophages (62.5 and 125 μg mL−1). According to the results, cytosolic NF-κB p50 and p65 proteins were decreased upon the treatment of LPS. However, with the treatment of 8 : 2 combination the level of cytosolic NF-κB in cytosol increased dose-dependently (Fig. 5A & B). In addition, we also evaluated the translocation of NF-κB p50 and p65 to the nucleus in LPS-exposed RAW 264.7 cells. The results revealed, level of NF-κB protein translocation reduced with the treatment of seaweed combinations (Fig. 5C & D). Besides the NF-κB inhibitory properties, 8 : 2 combination treatment inhibited MAPK protein phosphorylation in LPS-stimulated RAW 264.7 macrophages (Fig. 5E & F). Specifically, co-treatment of 8 : 2 suppress the phosphorylation of p38, ERK1/2, and JNK in cytosol with a dose-dependent way.

Effects of Ecklonia cava (ethanolic extracts of Ecklonia cava, ECE), and Sargassum horneri (ethanolic extracts of Sargassum horneri, SHE) 8 : 2 combinations on lipopolysaccharide (LPS)-induced nuclear factor κB (NF-κB) and mitogen-activated protein kinase (MAPK) protein expression. The protein expression of NF-κB p50 and p65 in cytosol (A & B) and nucleus (C & D) were analyzed by western blotting. Similarly, the protein expression of phospho-ERK, ERK, phospho-JNK, JNK, phospho-p38, and MAPK p38 in cytosol (E & F) were analyzed by western blotting. ImageJ software used to determine the intensity of bands. The values shown are the means ± standard deviations (n = 3). **p < 0.01 vs. the LPS-treated group.
DISCUSSION
Seaweeds are considering as a promising source of natural marine anti-inflammatory compounds. During the last few decades, a number of studies demonstrated the extracts separated from seaweeds carrying promising anti-inflammatory properties under in vivo and in vitro conditions (Lee et al. 2013, Fernando et al. 2017). EC, edible brown seaweed, is abundantly growing in Jeju Island, Korea. A number of studies suggested, the metabolites presence in EC such as carotenoid, phlorotannins, and sulfated polysaccharides owing different biological activities to use as functional ingredients in the industrial applications (Heo et al. 2009). In contrast to EC, SH is edible brown seaweed with promising bioactive properties including anti-inflammatory and antioxidants. SH growing along the coasts of Korea, Japan, and China (Wang et al. 2015, Sanjeewa et al. 2017). Moreover, both seaweeds are popular as functional ingredients in the industries like functional foods and cosmeceuticals (Wang et al. 2015). In the present study, authors extracted SH and EC using 70% ethanol solution to evaluate anti-inflammatory properties of each seaweed extract and their combinations.
NO and PGE2 are inflammatory mediators, induced by the inflammatory cytokines or LPS in numerous cell types such as macrophages. Activated macrophages promptly produce large amounts of inflammatory mediators such as NO, PGE2, and pro-inflammatory cytokines (IL-1β, IL-6, and TNF-α) (Yang et al. 2014). According to the previous studies, the ethanolic extracts separated from brown algal species, have the potential to inhibit inflammatory responses of activated RAW 264.7 macrophages in a dose-dependent manner around the concentrations between 0 and 200 μg mL−1 (Lee et al. 2012). In the present study, we also noted that the concentrations starting from 15.6 to 250 μg mL−1 and their combinations have an inhibitory effect against LPS-induced NO secretion in RAW 264.7 macrophages (Figs 1 & 2).
Expression levels of iNOS and COX-2 from LPS-activated macrophages triggers the signaling cascades related to the inflammatory responses by inducing production of NO and PGE2, respectively (Seo et al. 2016, Torres-Rodríguez et al. 2016). Previously, Wijesinghe et al. (2012) and Kim et al. (2015) reported the ethanolic extracts from EC and SH has a potential to inhibit LPS-induced iNOS and COX-2 production from RAW 264.7 macrophages (Wijesinghe et al. 2012, Kim et al. 2015). Similar to previous observations, treatment of ECE and SHE inhibited the elevated iNOS and COX-2 production from activated macrophages. Interestingly, the combinations synergistically decreased the levels of iNOS and COX-2 than ECE and SHE (Fig. 3). Cytokines are non-structural tiny proteins with small molecular weights ranging from 8 to 40,000 Da. In general, cytokines such as IL-1β and TNF-α are acting as the inducers of endothelial adhesion molecules (Dinarello 2000). The endothelial adhesion molecules are critical for the attachment of leukocytes to the endothelial surface before migration into the tissues in order to eliminate immune-stimulants. However, the excessive production of these cytokines are responsible to up-regulate the expression of inflammation-associated genes like iNOS, COX-2, and the activation of NF-κB signal transduction pathway (Dinarello 2000). Therefore, inhibition or down-regulation of cytokine production is a possible approach to control unusual inflammatory responses. Previously, Yang et al. (2010) demonstrated the ethanolic extracts separated from brown seaweeds have a potential to inhibit pro-inflammatory cytokine production in LPS-activated RAW 264.7 cells (Yang et al. 2010). In addition, Wijesinghe et al. (2012) also reported the ethanolic extract separated from EC has a potential to suppress the production of pro-inflammatory cytokines in the activated macrophages (Wijesinghe et al. 2012). According to mRNA expression profiles it is clear that the combinations of ECE and SHE more effective than the single extracts. In the present study, we observed the expression ratios of IL-1β and IL-6 on LPS-stimulated group was 5,936 and 2,169, respectively. These results are in agreement with previous reports by Zhang et al. (2015), Mikołajczak et al. (2015), and Won et al. (2006) where most studies reported that the expression levels of IL-1β to the LPS relatively higher than the other pro-inflammatory mediators (Won et al. 2006, Mikołajczak et al. 2015, Zhang et al. 2015).
In this study, we demonstrated combination of seaweed extracts into different ratios has a potential to increase anti-inflammatory effect synergistically against LPS-stimulation. Specifically, in some traditional medicinal applications, natural ingredients are mixed together in different ratios to treat different disease conditions. Previously, several studies reported algal extract has a potential to synergistically increase properties like antioxidant and anti-bacterial (Le Tutour 1990, Lee et al. 2014a). Similarly, we also demonstrated combinations of ECE and SHE into different ratios have a potential to increase anti-inflammatory properties than the single extracts. These findings might be useful in future to develop some functional products from seaweeds like cosmeceuticals and functional foods with a low cost.
In summary, the present study demonstrated that the LPS-activated expressions of iNOS, COX-2, IL-1β, IL-6, and TNF-α inhibited by ECE, SHE and their combinations. Specifically, the combinations of seaweed extracts (8 : 2) had more inhibitory effect on the inflammatory mediators than the single seaweed extracts. These findings give a solid information that the combinations of seaweed extracts have a great deal of potential to increase anti-inflammatory effects than the single extracts. The increased anti-inflammatory effect of combinations might due to the different bioactive properties of active compounds present in SHE and ECE. However, further works are warranted to reveal how these combinations increased anti-inflammatory effects than the single extracts.
ACKNOWLEDGEMENTS
This research was supported by the 2018 scientific promotion program funded by Jeju National University.