Intraspecific variations in macronutrient, amino acid, and fatty acid composition of mass-cultured Teleaulax amphioxeia (Cryptophyceae) strains
Article information
Abstract
To compare the nutritional quality of TPG (Teleaulax/Plagioselmis/Geminigera) clade species of cryptomonads with that of RHO (Rhodomonas/Rhinomonas/Storeatula) clade species 6 Teleaulax amphioxeia (TA) and 1 Rhinomonas sp. strains were mass-cultured in newly designed 500-L photobioreactors to the end of exponential growth phase. Intraspecific variations (IVs) in terms of one standard deviation among the 6 TA strains in the compositions of the three macronutrients were 41.5 (protein), 89.8 (lipid), and 15.6% (carbohydrate) of the mean. When harvested from stationary growth phase mean compositions of essential amino acids (EAAs, 47.3%) and non-EAAs (52.7%) of the 2 TA strains, CR-MAL07 and CR-MAL08-2, were similar to those of a Chroomonas strain. The IVs between the 2 TA strains in the composition of EAAs (10.3 and 2.4) and non-EAAs (8.5 and 2.1% of the mean) were rather smaller than those of saturated fatty acids (30.3 and 26.1) and unsaturated fatty acids (UFAs, 12.0 and 12.5% of the mean) in f/2-Si and urea-based compound fertilizer (UCF) culture media, respectively. Mean compositions of eicosapentaenoic acid (EPA, 17.9%) and docosahexaenoic acid (DHA, 12.7%) of total fatty acids of the 2 TA strains were higher than those that of a Chroomonas strain. EPA and DHA compositions exhibited similar level of IVs between the 2 TA strains in f/2-Si (14.6 and 11.0) and UCF media (12.6 and 13.5% of the mean). Thus, the nutritional quality in terms of amino acids, UFAs, EPA, and DHA in a TPG clade species, T. amphioxeia was comparable to those of RHO clade species with notable IVs. Practically, biotechnological targets for TPG clade cryptomonad strains might be subspecies or clone level.
INTRODUCTION
“TPG (Teleaulax/Plagioselmis/Geminigera)” and “RHO (Rhodomonas/Rhinomonas/Storeatula)” clades of cryptomonads include potentially useful species for the novel biotechnological advancement in the field of health-promotion, novel solar energy utilization, and the aquaculture (Scholes and Rumbles 2006, Dean et al. 2016, Jumper et al. 2018). For example, TPG clade species including strains of Teleaulax genus with particularly high eicosapentaenoic acid (EPA) contents are expected to be excellent food for the enrichment of prey zooplankton (Peltomaa et al. 2018). RHO clade species are also known to have photophysically very efficient light-harvesting plastid systems (Doust et al. 2006, Marin et al. 2011, Kim et al. 2015, 2017) with the key proteins such as phycobiliproteins, chlorophyll a/c antenna proteins, and photosystem I supercomplex in Rhodomonas salina (Kuthanová Trsková et al. 2019).
The idea of utilizing TPG/RHO clades in aquaculture is based on their integrated position in protistan food webs such as a phototroph (Ha 2009), a bacterivore on heterotrophic bacteria and cyanobacteria in the genus Synechococcus (Yoo et al. 2017), and prey for many ciliates and dinoflagellates (Stoecker et al. 1987, 2009, Jeong et al. 2010). Besides, rapid decay of TPG/RHO strains upon virus infection has been noted as a contributor to recycling of cellular nutrients (Nagasaki et al. 2009). Thus, many strains of “RHO clade” cryptomonads have been used to rear the prey zooplankton for marine aquaculture owing to their high content of quality nutrients (Chu et al. 2008, Seixas et al. 2009, Zhang et al. 2014, Boelen et al. 2017, Peltomaa et al. 2017).
According to its critical ecological roles, TPG clade has been reported to form recurrent red tides in some estuaries and coastal waters with subsequent ecologically critical influences (Pastoureaud et al. 2003, Seoane et al. 2005). Teleaulax amphioxeia (TA) in TPG clade is a prey for ciliate, Mesodinium rubrm in temperate seas, which is then fed by dinoflagellates in the genus, Dinophysis that belongs to diarrhetic shellfish poisoning group. Actually, a TA CR-MAL01 (Kim 2002) established from Gomso Bay samples were offered to establish the Korean M. rubrum MR-MAL01 strain as the first M. rubrum clone in temperate seas (Yih et al. 2004). The first Dinophysis strain DA-MAL01 (Park et al. 2006) was set up by rearing a D. acuminata cell from Masan Bay with prey cells of M. rubrm MR-MAL01 strain.
The top priority for biotechnological application of TPG clade species would be the selection of strains with beneficial and specific characters (Kim et al. 2016, Yoon et al. 2017, Lim et al. 2018). Whether excellent characters are largely determined by species of vary among individual strains awaits further studies. Previous reports have noted that interclonal differences could be greater than the interspecific one in many marine protistan groups (Weisse 2002, Lundholm et al. 2006, Hubbard et al. 2008). In the present study, we characterized the relative compositions of the three macronutrients and the major fractions of amino acids and fatty acids in cryptomonad cultures of TA in the TPG clade, Rhinomonas sp. in the RHO clade, and Chroomonas sp. as an outgroup at the end of exponential growth phase and the stationary growth phase of 500-L mass culture. We report here a large intraspecific variations (IVs) in nutritional characters between the 2 TA strains, which exceeded those among the three cryptomonad species. EPA and docosahexaenoic acid (DHA) contents were high among TA strains, assuring its proven quality as a feedstock. Our results emphasize the variability of nutritional characters in mass culture and warrant further efforts in strain development together with establishing best culture conditions.
MATERIALS AND METHODS
Experimental strains
Establishment of experimental strains
Eight strains of crytomonads in “TPG clade” in Korean coastal waters (Fig. 1) were set up by the single cell isolation method using capillary-tip Pasteur pipettes (Stein 1973). The eight strains include 6 from TA, one from genus Rhinomonas, and the other one from genus Chroomonas (Table 1). Single cells were isolated under a light microscope (Olympus BX-50; Olympus, Tokyo, Japan), each to be transferred to a chamber of the 24-well culture plate with f/2-Si medium (Guillard and Ryther 1962) and maintained at 20°C under continuous illumination of 50 μmol photons m−2 s−1 from white fluorescent lamps. Purely grown clonal cells were transferred to a culture tube with its own strain name and number, “CR-MAL##.” When sampling, temperature and salinity of the waters samples were 5.4–28.9°C and 20.3–32.5 psu, respectively (Table 1).
Sampling stations for the isolation of cryptomonad single cells. A, Taean; B, Gunsan; C, Gimje; D, Gochang; E, Shinan; F, Masan; G, Seoguipo.
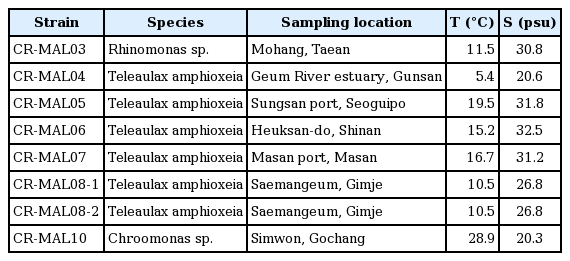
Strain name-number, species name, sampling location, and environmental parameters of the seawater samples
Phylogenetic analyses of the experimental strains
Total genomic DNA was extracted from cultured cells as previously described (Choi et al. 2013). The chloroplast psbA gene was amplified and sequenced using the specific primers (Table 2). The alignment for psbA gene sequence was aligned by the eye and was edited using the Genetic Data Environment (GDE 2.6) program (Smith et al. 1994).

PCR and sequencing primers
A dataset of 894 characters for 39 strains of cryptophytes were analyzed for the phylogeny. Maximum likelihood (ML) phylogenetic analyses were performed using RAxML ver. 8.0.0 (Stamatakis 2014) with the general time-reversible plus gamma (GTR + GAMMA) model. The data were analyzed by 1,000 independent tree inferences using the -# option to identify the best tree. The model parameters with gamma correction values and proportion of invariable sites in the combined dataset were obtained automatically by the program. Bootstrap support values (ML) were calculated using 1,000 replicates with the same substitution model. Bayesian analyses were run using MrBayes 3.2.6 (Ronquist et al. 2012) with a random starting tree, two simultaneous runs (nruns = 2) and four Metropolis-coupled Markov chain Monte Carlo (MC3) algorithms for 2 × 10⁷ generations, with one tree retained every 1,000 generations. The burn-in point was identified graphically by tracking the likelihoods (Tracer v.1.6, http://tree.bio.ed.ac.uk/software/tracer/). The first 5,000 trees were discarded, and the remaining 15,001 trees were used to calculate the posterior probabilities for each clade. Trees were visualized using FigTree v.1.4.2 (http://tree.bio.ed.ac.uk/software/figtree/).
Construction of 500-L photobioreactors
For the present study a new type of photobioreactor (PBR) with polycarbonate (PC) culture column was devised and constructed. Each PBR was designed to contain a 500 L culture in a cylindrical column made of transparent polycarbonate plastic with an up-right central lighting tube. Each PBR system is equipped with an outer pretreatment unit for the basal seawater, and a drainpipe connects from the bottom center of the culture column to the outside for harvesting by continuous centrifuge system
Pretreatment of basal seawater and operation of the 500-L PBR cultures
Basal seawater (about 30 psu salinity) for mass culture media was taken from a coastal site of Gunsan City, to be pretreated with sand filtration and then sterilized by autoclaving or 2–3 day UV irradiation after microfiltration through a cartridge filter (mean filter rating of 1.0 μm). PBR cultures in 30 psu media were maintained at 20°C and 100 μM photon illumination. Twenty-liter inoculum at exponential growth stage (2–4 × 10⁵ cells mL−1) were used to start a 500-L mass-cultivation with initial cell density of 1–2 × 10⁴ cells mL−1. Five-milliliter aliquots were subsampled daily for direct cell counting under light microscope to estimate the daily growth of the PBR cultures. Previously, experimental scale of culture medium for the analyses of macronutrients, amino acids, or fatty acids in cryptomonads was mostly at the level of sub-liters (Volkman et al. 1989, Taipale et al. 2016, Peltomaa et al. 2018) and liters (Brown et al. 1997, Renaud et al. 1999, 2002). Rarely cultures in several tens of liters (Dunstan et al. 2005, Huerliman et al. 2010) were tested. Thus, for the comparison of the resulting data from our 500-L PBR cultures previous data like those in the above mentioned papers obtained from rather smaller scale cultures were referred. In practice, duplicate performance of such mass-cultivation experiment was not always allowable in the present study.
Preparation of 500-L PBR cultures at late-exponential growth phase for macronutrients analyses
Each of the 6 TA strains (CR-MAL04, CR-MAL05, CR-MAL06, CR-MAL07, CR-MAL08-1, and CR-MAL08-2) and a Rhinomonas sp. strain (CR-MAL03) was separately grown in a 500-L PBR with f/2-Si culture medium (Fig. 2). During the first 2–3 days rather slow growths were observed to be followed by exponential growth phases with over a doubling per day (Fig. 3). Cells were harvested at late-to-terminal exponential growth phase of each experimental strain (Fig. 2).
Photobioreactor cultures of Teleaulax amphioxeia strain CR-MAL07 at initial (A), early exponential (B), and late exponential (C) growth phase (GP).

Daily variations in cell density of the 7 experimental cryptomonad strains in 500-L photobioreactors.
Preparation of 500-L PBR cultures at stationary growth phase for the analyses of macronutrients, amino acids, and fatty acids
Each of the 3 strains (TA CR-MAL07, TA CR-MAL08-2, and Chroomonas sp. CR-MAL10) was separately grown in a 500-L PBR with two different culture media to the stationary growth phase (Fig. 4) to analyze amino acid and fatty acid in the harvested pellets. Both the f/2-Si (Guillard and Ryther 1962) and the urea-based compound fertilizer (UCF) culture media were tested. To prepare UCF culture medium 120 gram of compound fertilizer (N : P : K = 21 : 17 : 17) and 160 gram urea fertilizer (N = 46%) were dissolved into 1,000 L sterilized seawater (Table 3). Additional illumination from external white fluorescent lamps fixed on two separate plywood panels and strengthened aeration were applied to the PBR during high-density stationary growth phase (Fig. 4) for the adjusted effective illumination of 100–200 μmol photons m−2 s−1 and also for the homogeneous spatial mixing.
Three sets of two 500-L photobioreactors with stationary growth phase cultures of Teleaulax amphioxeia strains CR-MAL07 (A), T. amphioxeia CR-MAL08-2 (B), and Chroomonas sp. CR-MAL10 (C).

Chemical formula for the f/2-Si and UCF culture medium
Harvesting 500 L PBR cultures
The Continuous High-speed Centrifugation Device (Hanil Electric Co., Seongnam, Korea) were operated at 10,000 rpm to get about 500 mL ultra-high density cultures from the 500 L cultures in PBRs. The harvested ultra-high density cultures with cell densities of about 3.0–4 × 10⁸ cells mL−1 were then kept frozen in the dark chamber for later chemical analyses.
Analyses of macronutrients, amino acids, and fatty acids in the 500-L PBR cultures
Chemical composition of the cryptophyte cell pellets was determined according to the Association of Analytical Chemists method (Association of Analytical Chemists 1995). The crude protein content and crude lipid contents of samples were determined using the semi-micro Kjeldahl method and soxhlet extraction method, respectively. The carbohydrate content was determined by calculating the percent remaining after all the other components such as moisture, protein, lipid, and ash. Pellets were extracted in 70% ethanol for 30 min and neglected for 10 min. The amino acid analyzer using Hitachi HPLC Packed Column with Ion-exchanging Resin No. 2622 PF (4.6 × 60 mm) and UV detector (570, 440 nm) was used for analysis of amino acids (Hitachi L-8900; Hitachi High-Technologies Corp., Tokyo, Japan). Twenty-microliters of each sample was injected and determination was performed using Ninhydrin reagent set (Wako Chemical Inc., Osaka, Japan). Fatty acid in the pellets was converted to the corresponding fatty acid methyl esters with 2 mL of methanolic hydrogen chloride under nitrogen at 90°C for 45 min. Fatty acid methyl esters were analyzed on a flexible silica capillary column (SP 2560: 100 m × 0.25 mm, i.d.; Supelco, Inc., Bellefonte, PA, USA) in an HP6890 gas liquid chromatograph (Agilent Technologies Inc., Santa Clara, CA, USA), equipped with a flame-ionization detector and an automated injector.
RESULT AND DISCUSSION
Phylogenetic relationships among the experimental cryptomonad strains
Results of maximum likelihood analyses of chloroplast psbA gene sequences from 39 strains of cryptophytes for the phylogeny are summarized in Fig. 5. All of the six TA strains formed a separate “Teleaulax” group with the two previously registered TA strains, SCCAP KO434 AY453068 and HCCP-CR01(=CR-MAL01) NC027589. Experimental TA strain CR-MAL08-2 was closest to SCCAP KO434 AY453068 while CR-MAL08-2 was closest to HCCP-CR01(=CR-MAL01) NC027589. Experimental Rhinomonas sp. strain CR-MAL03 positioned next to the Rhodmonas spp. strains as was in the case of experimental Chrooomonas sp. strain CR-MAL10 which was located within the Chrooomonas spp. group (Fig. 5). Thus, the 8 experimental cryptomonad strains belongs to TPG clade (6 TA strains), RHO clade (strain CR-MAL03), or CHRO clade (strain CR-MAL10) (Hoef-Emden et al. 2002).
Consensus Bayesian tree of the cryptophytes based on combined plastid psbA gene sequences. The Bayesian posterior probability and maximum-likelihood (RAxML) supported bootstrap values are shown above or below the branches. Scale bar represents number of substitutions/site.
Construction of 500-L PBR
The newly constructed 500-L PBR has a culture chamber in the form of a cylindrical column (0.8 m wide and 1.2 m high, with 500 L capacity) made of transparent PC with conical bottom (Fig. 6) equipped with an up-right central lighting tube (maximum 200 μmol photons m−2 s−1) with fluorescent lamps inside ([5] in Fig. 6). An aerator on the inside bottom was connected to the outer air pump ([2] in Fig. 6) supplying pre-cleaned air through a system of carbon-cartridge filters ([4] in Fig. 6) and UV-lamps ([3] in Fig. 6). From the bottom center of the PBR a drainpipe connects to the outside ([6] in Fig. 6) for harvesting by the continuous centrifuge system (Continuous High-speed Centrifugation Device; Hanil Electric Co.) or for washing and cleaning of the culture chamber.
Schematic diagram of the 500-L cylindrical photobioreactor (PBR). Culture chamber (transparent area) inside a cylindrical polycarbonate column (0.8 m wide and 1.2 m high) with conical bottom is equipped with an up-right central lighting tube (5). An aerator on the inside bottom is connected to the outer air pump (2) supplying pre-cleaned air through a system of carbon-cartridge filters (4) and UV-lamps (3). From the bottom center of the PBR a drainpipe connects to the outside (6) for harvesting by continuous centrifuge system (Continuous High-speed Centrifugation Device, Hanil Electric Co.) or for washing and cleaning of the culture chamber. A control box (1) is set at the end of the clean-air supplying system.
Composition of the 3 macronutrients in the 500-L PBR cultures at late-to-terminal exponential growth phase
The 500-L PBR cultures in f/2-Si medium for the analyses of crude protein, lipid, and carbohydrates reached late-to-terminal exponential growth phase after 5–9 days of mass-cultivation (Fig. 3). Cell density at harvesting point for each strain was in the range of 3.0–4.8 × 10⁵ cells mL−1 (Table 4), which was only slightly lower (Ha 2009, Myung 2009) than or similar (Kim 2002) to the previously reported maximum culture densities of TA in small volume (500 mL) PC bottles.

Cell densities of the 500-L PBR cultures at harvesting points
Percent composition of crude protein, lipid, and carbohydrate of in each experimental 500-L PBR culture at late-to-terminal exponential growth phase showed wide ranges (Table 5). Of the TA strains CR-MAL04 exhibited highest lipid content (20%) which was also shown the same in Rhinomonas CR-MAL03. The other 5 TA strains were lower than 10% in lipid content. The TA strains, 07 and 08-2, were the highest in protein (40.6 and 41.4%, respectively) while strain 08-1 was the lowest in lipid (0.5%). When excluding strains 07 and 08-2, mean protein content of the other TA strains is quite close to Rhinomonas (23.4%). The composition of crude protein in freshwater cryptomonads (42.9–55.4%, in Peltomaa et al. 2017) and marine ones (53–64% in Dunstan et al. 2005, >65% in Seixas et al. 2009) was higher than those from our 500-L PBR cultures.
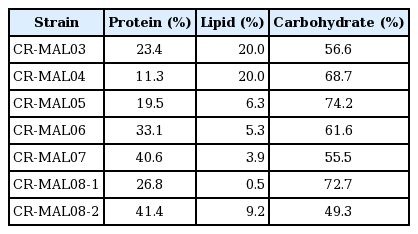
Composition of the 3 macronutrients in 500-L PBR cultures of the 7 cryptomonad strains at late-to-terminal exponential growth phase
The IVs represented by one standard deviation in the composition of the crude protein, lipid, and carbohydrate among the 6 TA strains (CR-MAL04 to CR-MAL08-2 in Table 4) were 11.94, 6.74, and 9.95, respectively. The IVs were equivalent to 41.5 (protein), 89.8 (lipid), and 15.6% (carbohydrate) of the mean of the 6 TA strains (Fig. 7). This result exhibited the evident differences among the strains even of same species in the relative composition of the major nutrients when grown to late exponential phases in the 500-L PBRs. Furthermore, it implies that not all the strains in a species may exhibit similar characteristics like a single group but the clone-specific characteristics of the strains are more important than the strain-averaged species-specific characters for biotechnological applications.
Relative composition of the three macronutrients in cryptomonad cells from the 500-L enriched cultures at the end of exponential growth phase in f/2-Si medium. Error bars represent standard deviations (SDs) for six Teleaulax amphioxeia strains (solid line) and SD for two values (dotted line), i.e., mean from the Teleaulax strains and the value from a Rhinomonas strain.
Composition of the 3 macronutrients in the 500-L PBR cultures at stationary growth phase
The 500-L PBR cultures in f/2-Si and UCF culture media for the analyses of the 3 macronutrients, amino acids and fatty acids reached stationary growth phase after 9–13 days of mass-cultivation (Fig. 8). Cell densities at harvesting point for the 3 strains (CR-MAL07, CR-MAL08-2, and CR-MAL-10) in f/2-Si and UCF culture media were in the range of 5.3–6.4 and 4.6–5.7 × 10⁵ cells mL−1, respectively (Table 6). When grown in f/2-Si medium the cell densities of the cryptomonad cultures at stationary growth phase (Table 6) were greater than those at late-to-terminal exponential growth phase (Table 5) by 1.3–2.1 times. Percent composition of crude protein (36.3–65.8%), lipid (5.7–12.8%), and carbohydrate (21.4–56.1%) of in each experimental 500-L PBR culture at stationary growth phase was quite variable among strains and between the two culture media (Table 7). Unlike the case of protein and carbohydrate compositions, the mean lipid composition of the 2 TA strains was higher than the compositions of a Chroomonas sp. strain CR-MAL10 in all the two culture media (Fig. 9). The composition of crude protein was comparable to that from the previous small-scale experiments (Dunstan et al. 2005, Seixas et al. 2009, Peltomaa et al. 2017).
Daily variations in cell density of the 3 experimental cryptomonad strains in 500-L photobioreactors. Cultures in f/2-Si media (black markers) grew faster and build up higher maximum cell densities than those in urea-based compound fertilizer media (white makers).
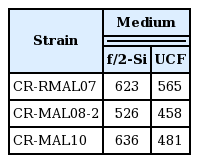
Maximum cell densities (×103 cells mL−1) of the 3 experimental strains grown in f/2-Si and UCF culture media
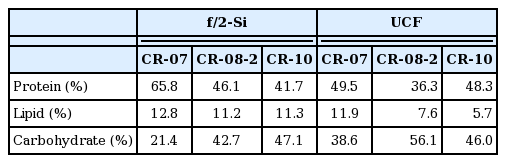
Composition of the 3 macronutrients in 500-L PBR cultures of the 3 cryptomonad strains at stationary growth phase

Relative composition of protein and lipid in cryptomonad cells from the 500-L high-density cultures at stationary growth phase. Cultures were grown in f/2-Si (A) and urea-based compound fertilizer medium (B). Error bars represent standard deviations (SDs) for two Teleaulax amphioxeia strains (solid line) and SD for two values (dotted line), i.e., mean from the Teleaulax strains and the value from a Chroomonas strain.
The IVs represented by one standard deviation between the 2 TA strains (CR-MAL07 and CR-MAL08-2) in the composition of the crude protein, lipid, and carbohydrate was 13.97, 1.07, and 15.04%, respectively when grown in f/2-Si medium while 9.33, 3.00, and 12.33%, respectively in UCF medium. The IVs in the compositions of all the three macronutrients between the 2 TA strains were equivalent to 25.0 and 21.8% (protein), 9.0 and 30.7% (lipid), and 46.9 and 26.1% (carbohydrate) of the mean of the 2 TA strains in f/2-Si and UCF culture media, respectively (Fig. 9). Thus, the IVs in the macronutrient compositions between the 2 TA strains when harvest at stationary growth phase were not so small to be considered “insignificant” except the case of lipid composition of the cultures grown in f/2-Si medium (Fig. 9).
Composition of amino acids in the 500-L PBR cultures at stationary growth phase
A total of 17 amino acids including 9 essential amino acids (EAAs) for marine fishes was analyzed using the pellets from the six 500-L PBR cultures (3 in f/2-Si and the other 3 in UCF culture media, Table 7) at stationary growth phase (Supplementary Table S1). Percentages of EAAs was roughly half of the total amino acids, with the maximum of 51.5% (CR-MAL08-2 in f/2-Si medium) and minimum of 44.5% (CR-MAL07 in UCF medium), and all the three strains showed rather higher compositions in f/2-Si medium than in UCF medium (Table 8). The percentages of EAAs were 53.4–71.6% in freshwater crytomonads (Peltomaa et al. 2017), 52.6% in a Chroomonas salina strain (Brown 1991), and 50.5–55.4% in 7 cryptomonad strains including 5 Rhodomonas strains (Dunstan et al. 2005).

Composition of EAA and non-EAA in 500-L PBR cultures of the 3 cryptomonad strains at stationary growth phase
The IVs in the composition of EAAs as well as non-EAAs in the 2 TA strains (CR-MAL07 and CR-MAL08-2) were by far greater in f/2-Si medium than those in UCF medium (Fig. 10). The IVs between the 2 TA strains in the composition of EAAs were equivalent to 10.3 and 2.4% of the mean while those of non-EAAs 8.5 and 2.1% of the mean in f/2-Si and UCF culture media, respectively (Fig. 10).
Relative composition of essential amino acid (EAA) and non-EAA in cryptomonad cells from the 500-L high-density cultures at stationary growth phase. Cultures were grown in f/2-Si (A) and urea-based compound fertilizer medium (B). Error bars represent standard deviations (SDs) for two Teleaulax amphioxeia strains (solid line) and SD for two values (dotted line), i.e., mean from the Teleaulax strains and the value from a Chroomonas strain.
Composition of fatty acids in the 500-L PBR cultures at stationary growth phase
Percentage composition of lipid among the 3 macronutrients were 5.7–12.8% in the 3 strains grown 500-L PBRs with f/2-Si or UCF media cultures (Table 7). In f/2-Si medium the lipid composition of the 2 TA strains, CR-MAL07 and CR-MAL08-2, were 12.8 and 11.2%, respectively at stationary growth phase (Table 7) in comparison with the rather lower values of 3.9 and 9.2%, respectively at late-to-terminal exponential growth phase (Table 5). In other smaller-scale cultures, however, the lipid composition of cryptomonad strain was in relatively higher ranges (10.0–21.7% in Renaud et al. 2002, 18–25% in Dunstan et al. 2005, and 9.5–20.5% in Huerliman et al. 2010).
Diverse quality fatty acids including the three major omega-3 unsaturated fatty acids (UFA) such as EPA, DHA, and α-linolenic acid (precursor to EPA) were found in the lipid fractions (Supplementary Table S2). Composition of UFA in total fatty acids varied from the minimum of 41.1% (CR-MAL07 in UCF culture medium) to the maximum of 56.7% (CR-MAL10 in f/2-Si culture medium) even with 30–50% of the unidentified portion among the total fatty acid (Table 9). The actual composition of UFA over the sum of UFA and saturated FA (SFA) might become comparable or even higher (79.5–87.1%, Table 9) than other cryptomoad strains (69.0–74.8% in Renaud et al. 2002 and 61.0–84.8% in Huerliman et al. 2010). The IVs between the SFAs or UFAs composition of the 2 TA strains (CR-MAL07 and CR-MAL08-2) harvest at stationary growth phase were equivalent to 30.3 and 26.1% of the mean (SFAs) and 12.0 and 12.5% of the mean (UFAs) in f/2-Si and UCF culture media, respectively (Fig. 11).

Composition of UFA and SFA in 500-L PBR cultures of the 3 cryptomonad strains at stationary growth phase
Relative composition of the unsaturated fatty acid (UFA) and saturated fatty acid (SFA) in cryptomonad cells from the 500-L high-density cultures at stationary growth phase. Cultures were grown in f/2-Si (A) and urea-based compound fertilizer (UCF) medium (B). Error bars represent standard deviations (SDs) for two Teleaulax amphioxeia strains (solid line) and SD for two values (dotted line), i.e., mean from the Teleaulax strains and the value from a Chroomonas strain.
Mean DHA composition was clearly higher in the 2 TA strains than the Chroomonas sp. strain by 24.2–47.8% while mean EPA composition was only slightly (by 3.8–6.5%) higher in the 2 TA strains (Table 10). Sum of the three major omega-3 fatty acids (DHA, EPA, and α-linolenic acid) was quite high ranging from 37.3% (CR-MAL07 in UCF culture medium) to 50.7% (CR-MAL10, f/2-Si culture medium) of total fatty acids (Table 10). When excluding the unidentified portion of the total fatty acids the above three major omega-3 fatty acids occupied 67–82% of the sum of SFA and UFA, and 84–95% of all UFA (Table 10). In sub-liter cultures (Peltomaa et al. 2018) 2 TA and a Chroomonas strains were shown to have similar sum of the three major omega-3 fatty acids (71.9 and 75.4%, respectively) of total fatty acids while the sum was 32.2–49.7% in 10 L carboy cultures of 7 cryptomonad strains including 5 Rhodomonas strains (Dunstan et al. 2005). The IVs between the composition of EPA and DHA were 2.76 and 1.34 (equivalent to 14.6 and 11.0% of the mean) in f/2-Si medium, and 2.12 and 1.77 (equivalent to 12.6 and 13.5% of the mean, respectively) in UCF medium (Fig. 12). Thus, the considerably high IVs in the relative compositions of SAFs were contrasted by the lowered but evident IVs UFAs, EPA, and DHA in a TPG clade species, TA.

Composition of EPA, DHA, and α-linolenic acid in 500-L PBR cultures of the 3 cryptomonad strains at stationary growth phase

Relative composition of the eicosapentaenoic acid (EPA) and docosahexaenoic acid (DHA) in cryptomonad cells from the 500-L high-density cultures at stationary growth phase. Cultures were grown in f/2-Si (A) and urea-based compound fertilizer (UCF) medium (B). Error bars represent standard deviations (SDs) for two Teleaulax amphioxeia strains (solid line) and SD for two values (dotted line), i.e., mean from the Teleaulax strains and the value from a Chroomonas strain.
CONCLUSION
Cryptomonad strains isolated from Korean coastal waters including 6 TA, a Rhinomonas sp., and a Chroomonas sp. strain were mass-cultivated in 500-L PBRs. Those cultures exhibited high nutritional quality and at the same time the considerable level of IVs in their relative composition of the 3 macronutrients and major groups of amino acids as well as fatty acids. In most combinations of mass culture experiments except the ones for amino acids, UFAs, EPA, and DHA, the IVs were large enough to be “evident.” The sizable and considerable level of IVs in the cellular nutrient compositions of the experimental TA strains is noteworthy for the selection of the biotechnologically best cryptomonad strains. Once excellent characters of a particular species are newly discovered establishment of best strains at the level of clonal cultures might be at the top priority for the biotechnological advancements using TPG clade species.
SUPPLEMENTARY MATERIAL
Supplementary Table S1. The amino acid composition (weight %) of the 3 cryptomonad strains harvested from 500-L PBR cultures at stationary growth phase (https://www.e-algae.org).
Supplementary Table S2. Relative concentrations of fatty acids (% of total fatty acids) of the 3 cryptomonad strains harvested from 500-L PBR cultures at stationary growth phase (https://www.e-algae.org).
ACKNOWLEDGEMENTS
This work was financially supported by the grant (R20180003) from the National Institute of Fisheries Science (NIFS), Republic of Korea, and also in part supported by the project entitled “Mass-production of multifunctional aquaculture live-feeds in renovative photo-bioreactors” funded by the KIMST (Korea Institute of Marine Science and Technology) and a Grant from NRF, MSIT, Korea (NRF-2015-M1A5A1041808).
Abbreviations
DHA
docosahexaenoic acid
EAAs
essential amino acids
EPA
eicosapentaenoic acid
IV
intraspecific variation
ML
maximum likelihood
PBR
photobioreactor
PC
polycarbonate
RHO
Rhodomonas/Rhinomonas/Storeatula
SFAs
saturated fatty acids
TA
Teleaulax amphioxeia
TPG clade
Teleaulax/Plagioselmis/Geminigera clade
UCF
urea-based compound fertilizer
UFAs
unsaturated fatty acids