Spatio-temporal distributions of the newly described mixotrophic dinoflagellate Yihiella yeosuensis (Suessiaceae) in Korean coastal waters and its grazing impact on prey populations
Article information
Abstract
To investigate the spatio-temporal distributions of the mixotrophic dinoflagellate Yihiella yeosuensis in Korean coastal waters and its grazing impact on prey populations, water samples were seasonally collected from 28 stations in the East, West, and South Seas of Korea and Jeju Island from April 2015 to October 2018. The abundances of Y. yeosuensis in the water samples were quantified using quantitative real-time polymerase chain reaction (qPCR). Simultaneously, the physical and chemical properties of water from all sampled stations were determined, and the abundances of the optimal prey species of Y. yeosuensis, the prasinophyte Pyramimonas sp. and the cryptophyte Teleaulax amphioxeia, were quantified using qPCR. Y. yeosuensis has a wide distribution, as is reflected by the detection of Y. yeosuensis cells at 23 sampling stations; however, this distribution has a strong seasonality, which is indicated by its detection at 22 stations in summer but only one station in winter. The abundance of Y. yeosuensis was significantly and positively correlated with those of Pyramimonas sp. and T. amphioxeia, as well as with water temperature. The highest abundance of Y. yeosuensis was 48.5 cells mL−1 in Buan in July 2017, when the abundances of Pyramimonas sp. and T. amphioxeia were 917.6 and 210.4 cells mL−1, respectively. The growth rate of Y. yeosuensis on Pyramimonas sp., calculated by interpolating the growth rates at the same abundance, was 0.49 d−1, which is 37% of the maximum growth rate of Y. yeosuensis on Pyramimonas sp. obtained in the laboratory. Therefore, the field abundance of Pyramimonas sp. obtained in the present study can support a moderate positive growth of Y. yeosuensis. The maximum grazing coefficient for Y. yeosuensis on the co-occurring Pyramimonas sp. was 0.42 d−1, indicating that 35% of the Pyramimonas sp. population were consumed in 1 d. Therefore, the spatio-temporal distribution of Y. yeosuensis in Korean coastal waters may be affected by those of the optimal prey species and water temperature. Moreover, Y. yeosuensis may potentially have considerable grazing impacts on populations of Pyramimonas sp.
INTRODUCTION
Dinoflagellates are a major component of marine ecosystems (Sherr and Sherr 2007, Taylor et al. 2008, Jeong et al. 2013). They play diverse roles in marine food webs (Hansen 1992, Coats 1999, Jeong 1999, 2010b, Yoo et al. 2009, Lee et al. 2016b, Stoecker et al. 2017, Kang et al. 2019a). Many autotrophic and mixotrophic dinoflagellates and a few heterotrophic dinoflagellates form red tides or harmful algal blooms that can alter the balance of marine food webs and cause large-scale mortalities of fish and shellfish (Glasgow et al. 1995, Park et al. 2013b, Jeong et al. 2017, Shumway et al. 2018). Thus, the distributions of dinoflagellates are a critical concern for scientists, government officials, aquaculture farmers, and the public (Burkholder et al. 1995, Jeong et al. 2006, Taylor et al. 2008, Kudela and Gobler 2012, Park et al. 2013a). In particular, when a dinoflagellate is newly described, its distribution should be explored.
For a long time, phototrophic dinoflagellates had been treated as obligate autotrophic dinoflagellates; thus, scientists had mainly studied their abiotic growth factors, such as light and nutrient availability (Eppley 1972, Egge and Aksnes 1992, Kim et al. 2004, Lee et al. 2017a, 2019a). However, in the last three decades, many phototrophic dinoflagellates have turned out to be mixotrophic dinoflagellates (Stoecker et al. 1997, Jeong et al. 1999, 2004, 2005a, 2005b, 2010a, 2010b, 2015, 2016, Adolf et al. 2008, Berge et al. 2008, Glibert et al. 2009, Lee et al. 2015, 2016a). Furthermore, several newly described dinoflagellates have been revealed to be mixotrophic (Yoo et al. 2010, Kang et al. 2011, Jeong et al. 2012, Lee et al. 2014a, 2014b, Lim et al. 2015). Thus, the biotic factor of prey availability should be considered to understand population dynamics of mixotrophic dinoflagellates (Hansen 2011, Jeong et al. 2012, 2013, 2015, Stoecker et al. 2017).
Identifying dinoflagellates under a light microscope is very difficult for scientists, especially when the sizes of these organisms are less than 20 μm and the morphological differences among dinoflagellate species within a genus are small. Molecular techniques, such as quantitative real-time polymerase chain reaction (qPCR), partially solve the difficulty of differentiating dinoflagellate species (Smith et al. 2016, Lee et al. 2017b, 2019b, Kang et al. 2019b). Thus, to quantify the abundance of a small dinoflagellate and subsequently understand its distribution, molecular techniques should be used.
The dinoflagellate Yihiella yeosuensis, belonging to the family Suessiaceae, was newly described in 2017 (Jang et al. 2017b). It is one of the smallest dinoflagellates, having a length of 10 μm. Recently, Y. yeosuensis was revealed to be mixotrophic, and this mixotrophy significantly increased its growth rate (Jang et al. 2017a). However, Y. yeosuensis could feed only on the prasinophyte Pyramimonas sp. and the cryptophyte Teleaulax amphioxeia among 19 tested algal prey species (Jang et al. 2017a). In addition, Y. yeosuensis exhibits an anti-predation behavior, fast-backward jumping, against common heterotrophic protists (Jeong et al. 2018). Thus, the distribution of Y. yeosuensis may be affected by prey availability and abiotic factors, and relationships between Y. yeosuensis distribution and environmental factors should be investigated.
In this study, to investigate the spatio-temporal distributions of the mixotrophic dinoflagellate Y. yeosuensis in Korean coastal waters and the grazing impact of Y. yeosuensis on prey populations, water samples were collected seasonally from 28 stations in the East, West, and South Seas of Korea and Jeju Island from April 2015 to October 2018, and the abundances of Y. yeosuensis and the optimal prey Pyramimonas sp. and T. amphioxeia were quantified using qPCR. Simultaneously, physical and chemical properties of the waters at all sampled stations, such as water temperature, salinity, nutrient concentrations, and dissolved oxygen concentration, were measured. Furthermore, the grazing impact of Y. yeosuensis on Pyramimonas sp. populations was calculated by combining field data on the abundances of the predator and prey with ingestion rates of Y. yeosuensis on Pyramimonas sp. reported by Jang et al. (2017a). The results of this study provide a basis for understanding the distribution of Y. yeosuensis, the critical environmental factors affecting this distribution, and also the grazing impact of Y. yeosuensis on prey populations.
MATERIALS AND METHODS
Preparation of experimental organisms
Cells of Y. yeosuensis YYYS1405 were isolated from surface waters off Yeosu, in the South Sea of Korea (34°32′ N, 127°55′ E), when the water temperature and salinity were 18.6°C and 33.8, respectively (Jang et al. 2017b). Cells of Pyramimonas sp. PSSH1204 were isolated from surface waters off Shiwha Bay, West Sea of Korea, when the water temperature and salinity were 15.3°C and 27.4, respectively. Cells of T. amphioxeia CR-MAL01 were isolated from surface waters off Gomso Bay, in the West Sea of Korea, when the water temperature and salinity were 7.8°C and 30.1, respectively (Yih et al. 2004). A clonal culture of each of these three species was used for qPCR, following two consecutive single-cell isolations. Pyramimonas sp. and T. amphioxeia were maintained in enriched f/2 seawater medium, while Y. yeosuensis was provided Pyramimonas sp. as prey. After the concentration of each species had increased sufficiently, the volume was increased to 32, 270, and 500 mL in polycarbonate bottles. The bottles were filled to capacity, capped, and placed on a shelf at 20°C, illuminated with an irradiance of 20 μmol photons m−2 s−1 provided by cool white fluorescent light, under a 14 : 10-h light-dark cycle.
Primer design and specificity testing
The internal transcribed spacer ribosomal (r) DNA sequences of Y. yeosuensis YYYS1405 and related dinoflagellate species obtained from GenBank were aligned using the program MEGA v.4 (Tamura et al. 2007). Additionally, the large subunit of ribulose-1,5-bisphosphate carboxylase/oxygenase (rbcL) gene sequence of Pyramimonas sp. PSSH1204 and related prasinophyte species obtained from GenBank were aligned. Finally, the large subunit rDNA sequences of T. amphioxeia CR-MAL01 and related cryptophyte species obtained from GenBank were aligned. Manual searches of the alignments were conducted to determine the unique sequences of Y. yeosuensis, Pyramimonas sp., and T. amphioxeia and thereby develop target species-specific qPCR assays using primer-probe sets able to discriminate the target species from other related species. For determining the optimal melting temperatures and secondary structures, the primer and probe sequences for each target species were analyzed using Primer 3 (Whitehead Institute, Cambridge, MA, USA; Howard Hughes Medical Institute, Cambridge, MA, USA; Howard Hughes Medical Institute, Chevy Chase, MD, USA) and Oligo Calc: Oligonucleotide Properties Calculator (Kibbe 2007). Subsequently, primers and probes were synthesized by BioResearch Technologies (Petaluma, CA, USA). The probes were dual-labeled at the 5′ and 3′ ends with the fluorescent dyes FAM and BHQ1 (BioResearch Technologies), respectively (Table 1). A species specificity test for the primers and probe for each target species was conducted using related species (Supplementary Table S1).

Sequences of the primer sets and probes for Yihiella yeosuensis (Yy), Pyramimonas sp. (Pyra), and Teleaulax amphioxeia (Ta) used in this study
Construction of standard curves and qPCR analysis
Standard curves were constructed using DNA obtained from dense cultures of the three species harvested by filtration through a 25-mm GF/C filter (Whatman Inc., Clifton, NJ, USA). Each culture in the exponential growth phase was used for qPCR. Specifically, DNA was extracted from cultures of Y. yeosuensis, Pyramimonas sp., and T. amphioxeia, each containing 100,000 cells in the final elution volume of 100 μL, using an AccuPrep Genomic DNA extraction kit (Bioneer, Daejeon, Korea), according to the manufacturer’s instructions. The extracted DNA was then serially diluted by adding predetermined volumes of deionized sterile water (DDW) (Bioneer) to 1.5-mL tubes to ultimately prepare a 6-fold dilution series for all species, targeting 100, 10, 1, 0.1, 0.01, and 0.001% of the initially extracted DNA. Subsequently, the DNA samples were stored at −20°C, and a qPCR amplification was conducted within a day. The qPCR assays used to prepare the standard curve were performed using 1 μL of the DNA template, 0.2 μM of primers (forward and reverse), 0.15 μM of the probe (final concentrations), and 5 μL of the qPCRBIO Probe Separate-ROX (Genepole, Gwangmyeong, Korea) prepared with DDW to achieve a final volume of 10 μL. The qPCR assays were performed using a Rotor-Gene Q (Qiagen, Hilden, Germany) and the following thermal cycling conditions: 3 min at 95°C, followed by 45 cycles for 10 s at 95°C and 40 s at 58°C.
Quantification of the abundances of Yihiella yeosuensis and its optimal prey species in Korean waters
For qPCR analysis, 50–300 mL of water samples collected from each station in each time interval were filtered through a 25-mm GF/C filter (Whatman Inc., Clifton, NJ, USA). The filter had been loosely rolled and placed into a 1.5-mL tube and frozen at −20°C until it was transported to the laboratory. For each sample, DNA was extracted from the cells captured on the filters using an AccuPrep Genomic DNA extraction kit (Bioneer), according to the manufacturer’s instructions.
To determine the abundances of Y. yeosuensis, Pyramimonas sp., and T. amphioxeia in field samples, the aforementioned qPCR assay conditions were used. The DNA from each sample was amplified four times to ensure the accuracy of the results. A sample containing DDW as the template was used as a negative control, whereas one used for standard curve construction was used as a positive and standard control.
Hydrographical properties
Using a clean bucket, surface water samples were collected from 28 stations located in the East, West, and South Seas of Korea and Jeju Island, Korea, in April, July, and October of 2015; January, March, July, October, and December of 2016; March, July, and October of 2017; and January, March, July, and October of 2018 (Fig. 1). As the water depth at most stations was less than 3 m, only surface samplings of the stations were performed.
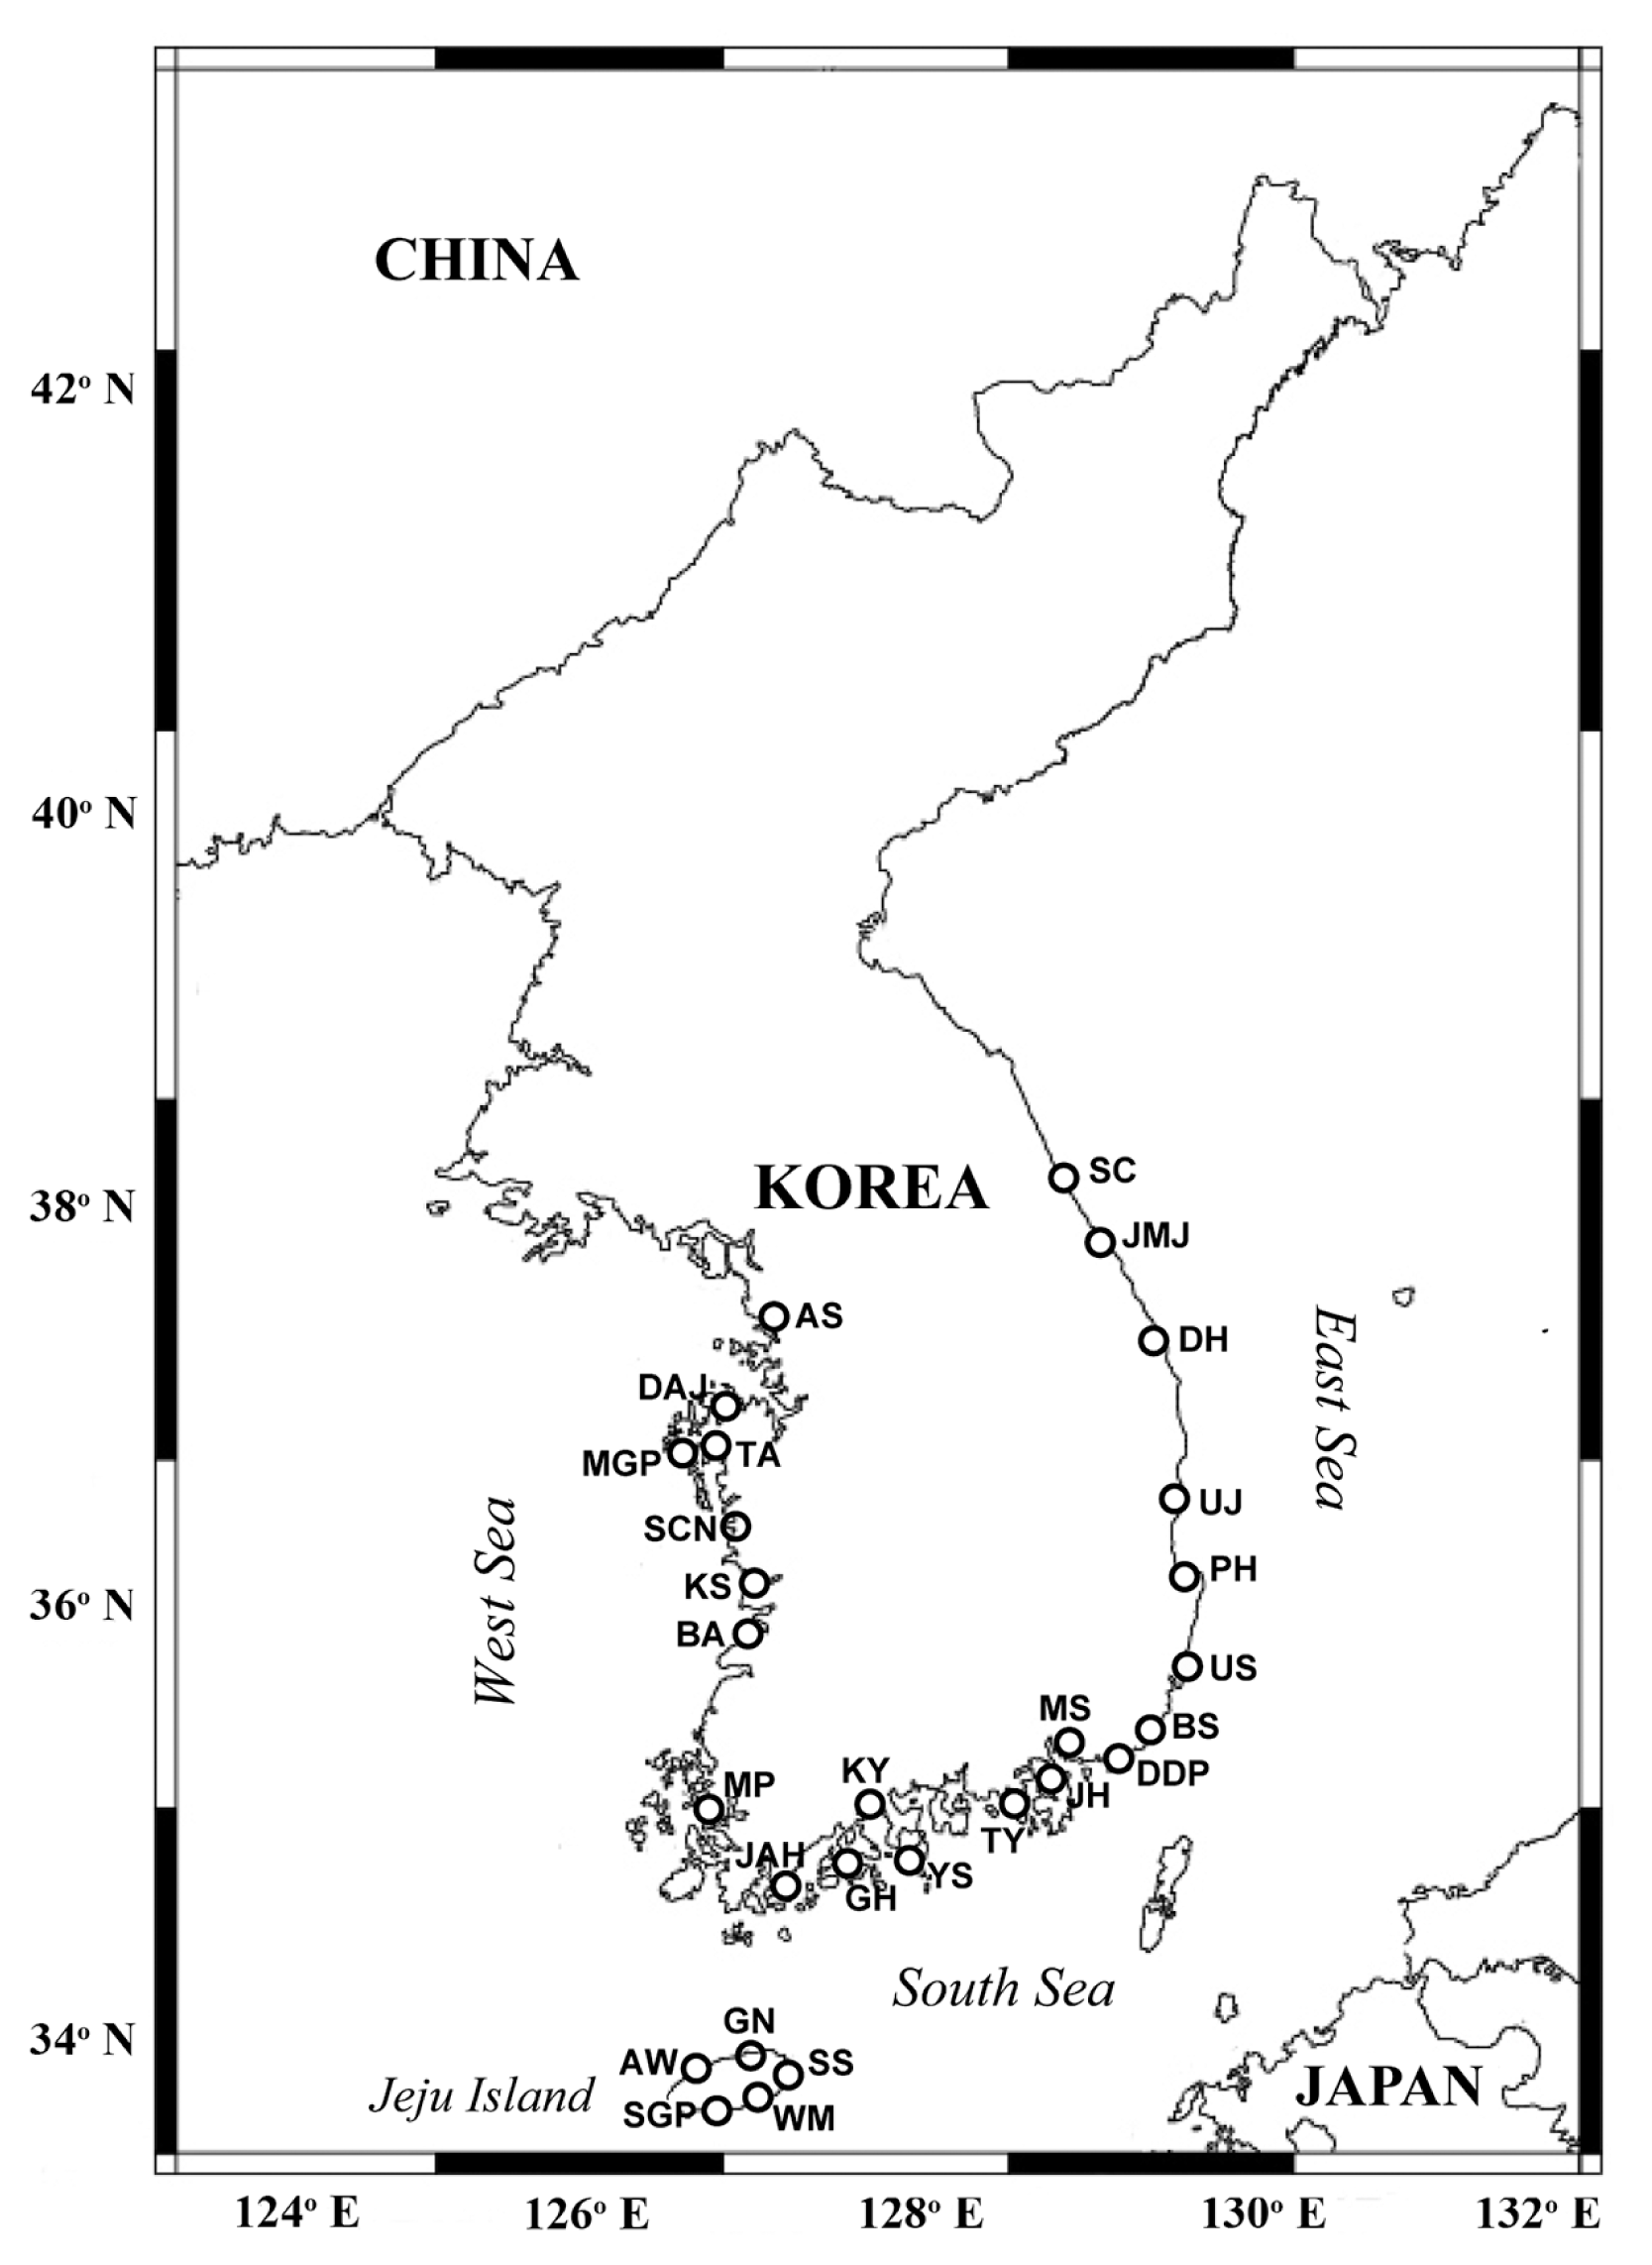
Map showing the sampling stations in Korean coastal waters during the study period. SC, Sokcho; JMJ, Jumunjin; DH, Donghae; UJ, Uljin; PH, Pohang; US, Ulsan; BS, Busan; DDP, Dadaepo; MS, Masan; JH, Jinhae; TY, Tongyoung; YS, Yeosu; KY, Kwangyang; GH, Goheung; JAH, Jangheung; AS, Ansan; DAJ, Dangjin; MGP, Mageompo; TA, Taean; SCN, Seocheon; KS, Kunsan; BA, Buan; MP, Mokpo; AW, Aewol; SGP, Seogwipo; WM, Wimi; SS, Seongsan; GN, Gimnyeong.
The temperature, salinity, and dissolved oxygen (DO) of the sampled water were measured using a YSI Professional Plus instrument (YSI Inc., Yellow Springs, OH, USA). For nutrient concentration analysis, the water samples were gently filtered through GF/F filters (Whatman Inc., Florham Park, NJ, USA) and stored at −20°C until the concentrations of nitrate plus nitrite (NO3 + NO2, hereafter NO3), phosphate (PO4), and silicate (SiO2) were measured using a nutrient auto-analyzer system (QuAAtro; Seal Analytical Gmbh, Norderstedt, Germany). The hydrographical profiles for the monitoring conducted during 2015–2018 were also described in our previous study (Kang et al. 2019b).
Grazing impacts
The grazing coefficients attributable to Y. yeosuensis feeding on the co-occurring Pyramimonas sp. were calculated by combining field data on the abundances of Y. yeosuensis and Pyramimonas sp. obtained in this study with ingestion rates of Y. yeosuensis on Pyramimonas sp. obtained by Jang et al. (2017a). The grazing coefficient g (d−1) was calculated using the following equation:
, where CR is the clearance rate (mL predator−1 h−1) of Y. yeosuensis for Pyramimonas sp. at a given prey concentration and PC is the predator concentration (cells mL−1). CR values were calculated using the following equation:
, where IR is the ingestion rate (cells eaten predator−1 h−1) of Y. yeosuensis for Pyramimonas sp. and x is the prey concentration (cells mL−1). CR values were corrected using Q10 = 2.8 (Hansen et al. 1997) because the in situ water temperatures and the temperatures used in the laboratory for the experiment were different.
Data analysis
Statistical analyses were performed on a personal computer using the statistical software package SPSS ver. 23.0 (IBM Corp., Armonk, NY, USA). To investigate a one by one relationship between cell abundances and hydrographic factors, the Pearson correlation analysis test was used.
RESULTS
Spatial and temporal distributions of Yihiella yeosuensis and its optimal prey species in Korean waters
Y. yeosuensis showed a wide distribution in Korean coastal waters through the qPCR method. Y. yeosuensis was detected at 23 of 28 sampling stations in the study period (Fig. 2, Supplementary Table S2). Y. yeosuensis was not detected in the waters of the Seocheon (West Sea), Sokcho (East Sea), Wimi, Seongsan, and Gimnyeong stations (Jeju Island). The highest abundance of Y. yeosuensis (48.5 cells mL−1) was recorded at the Buan station (West Sea) in July 2017. One of the optimal prey species for Y. yeosuensis, Pyramimonas sp. was detected at all the stations (Fig. 3). The highest abundance of Pyramimonas sp. (917.6 cells mL−1) was obtained at the Buan station (West Sea) in July 2017. The other optimal prey species, T. amphioxeia, was also found at all the sampling stations (Fig. 4). The highest abundance of T. amphioxeia (666.5 cells mL−1) was found at the Seogwipo station (Jeju Island) in July 2018. Furthermore, the highest combined abundance of Pyramimonas sp. and T. amphioxeia (1,127.9 cells mL−1) was also found at the Buan station (West Sea) in July 2017.

Map of the sampling stations, indicating the presence and absence of Yihiella yeosuensis in spring (March or April) (A), summer (June or July) (B), autumn (September or October) (C), and winter (December or January) (D) from 2015 to 2018. The green closed circles indicate the stations at which Y. yeosuensis cells were detected, whereas the black open circles indicate the stations at which Y. yeosuensis cells were not detected. SC, Sokcho; JMJ, Jumunjin; DH, Donghae; UJ, Uljin; PH, Pohang; US, Ulsan; BS, Busan; DDP, Dadaepo; MS, Masan; JH, Jinhae; TY, Tongyoung; YS, Yeosu; KY, Kwangyang; GH, Goheung; JAH, Jangheung; AS, Ansan; DAJ, Dangjin; MGP, Mageompo; TA, Taean; SCN, Seocheon; KS, Kunsan; BA, Buan; MP, Mokpo; AW, Aewol; SGP, Seogwipo; WM, Wimi; SS, Seongsan; GN, Gimnyeong.
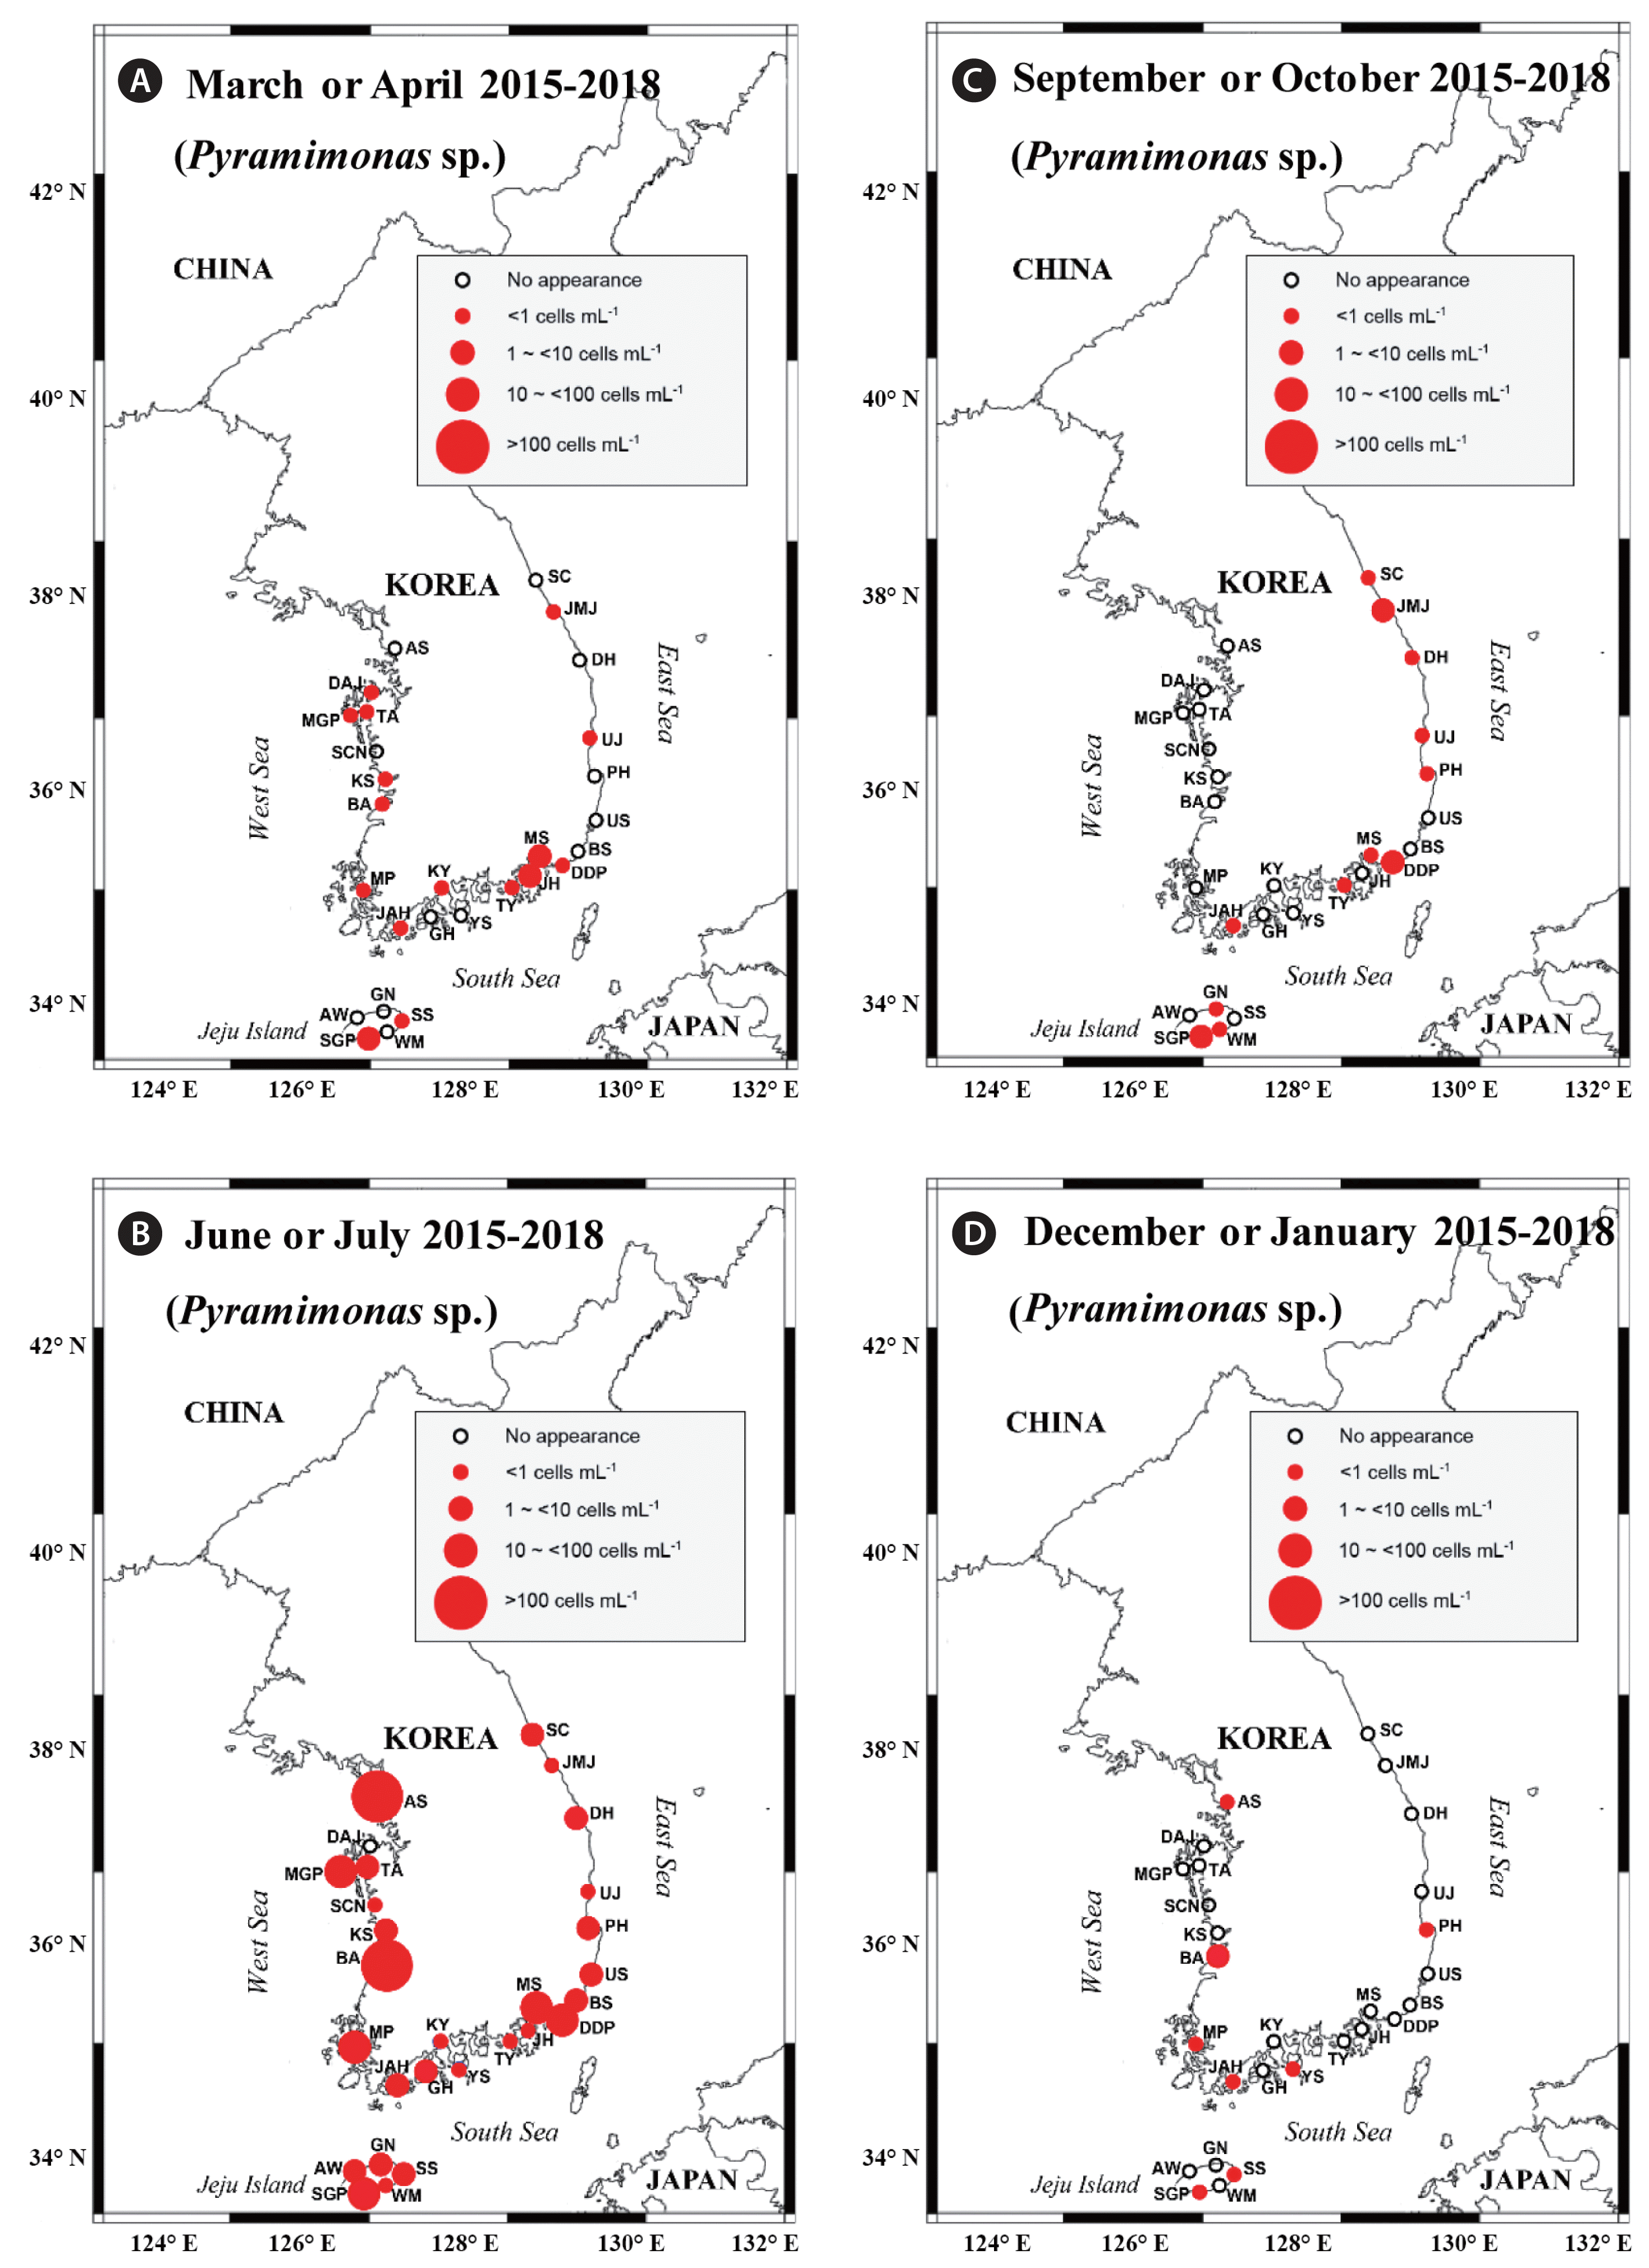
Map of the sampling stations, indicating the presence and absence of Pyramimonas sp. in spring (March or April) (A), summer (June or July) (B), autumn (September or October) (C), and winter (December or January) (D) from 2015 to 2018. The red closed circles indicate the stations at which Pyramimonas sp. cells were detected, whereas the black open circles indicate the stations at which Pyramimonas sp. cells were not detected. SC, Sokcho; JMJ, Jumunjin; DH, Donghae; UJ, Uljin; PH, Pohang; US, Ulsan; BS, Busan; DDP, Dadaepo; MS, Masan; JH, Jinhae; TY, Tongyoung; YS, Yeosu; KY, Kwangyang; GH, Goheung; JAH, Jangheung; AS, Ansan; DAJ, Dangjin; MGP, Mageompo; TA, Taean; SCN, Seocheon; KS, Kunsan; BA, Buan; MP, Mokpo; AW, Aewol; SGP, Seogwipo; WM, Wimi; SS, Seongsan; GN, Gimnyeong.
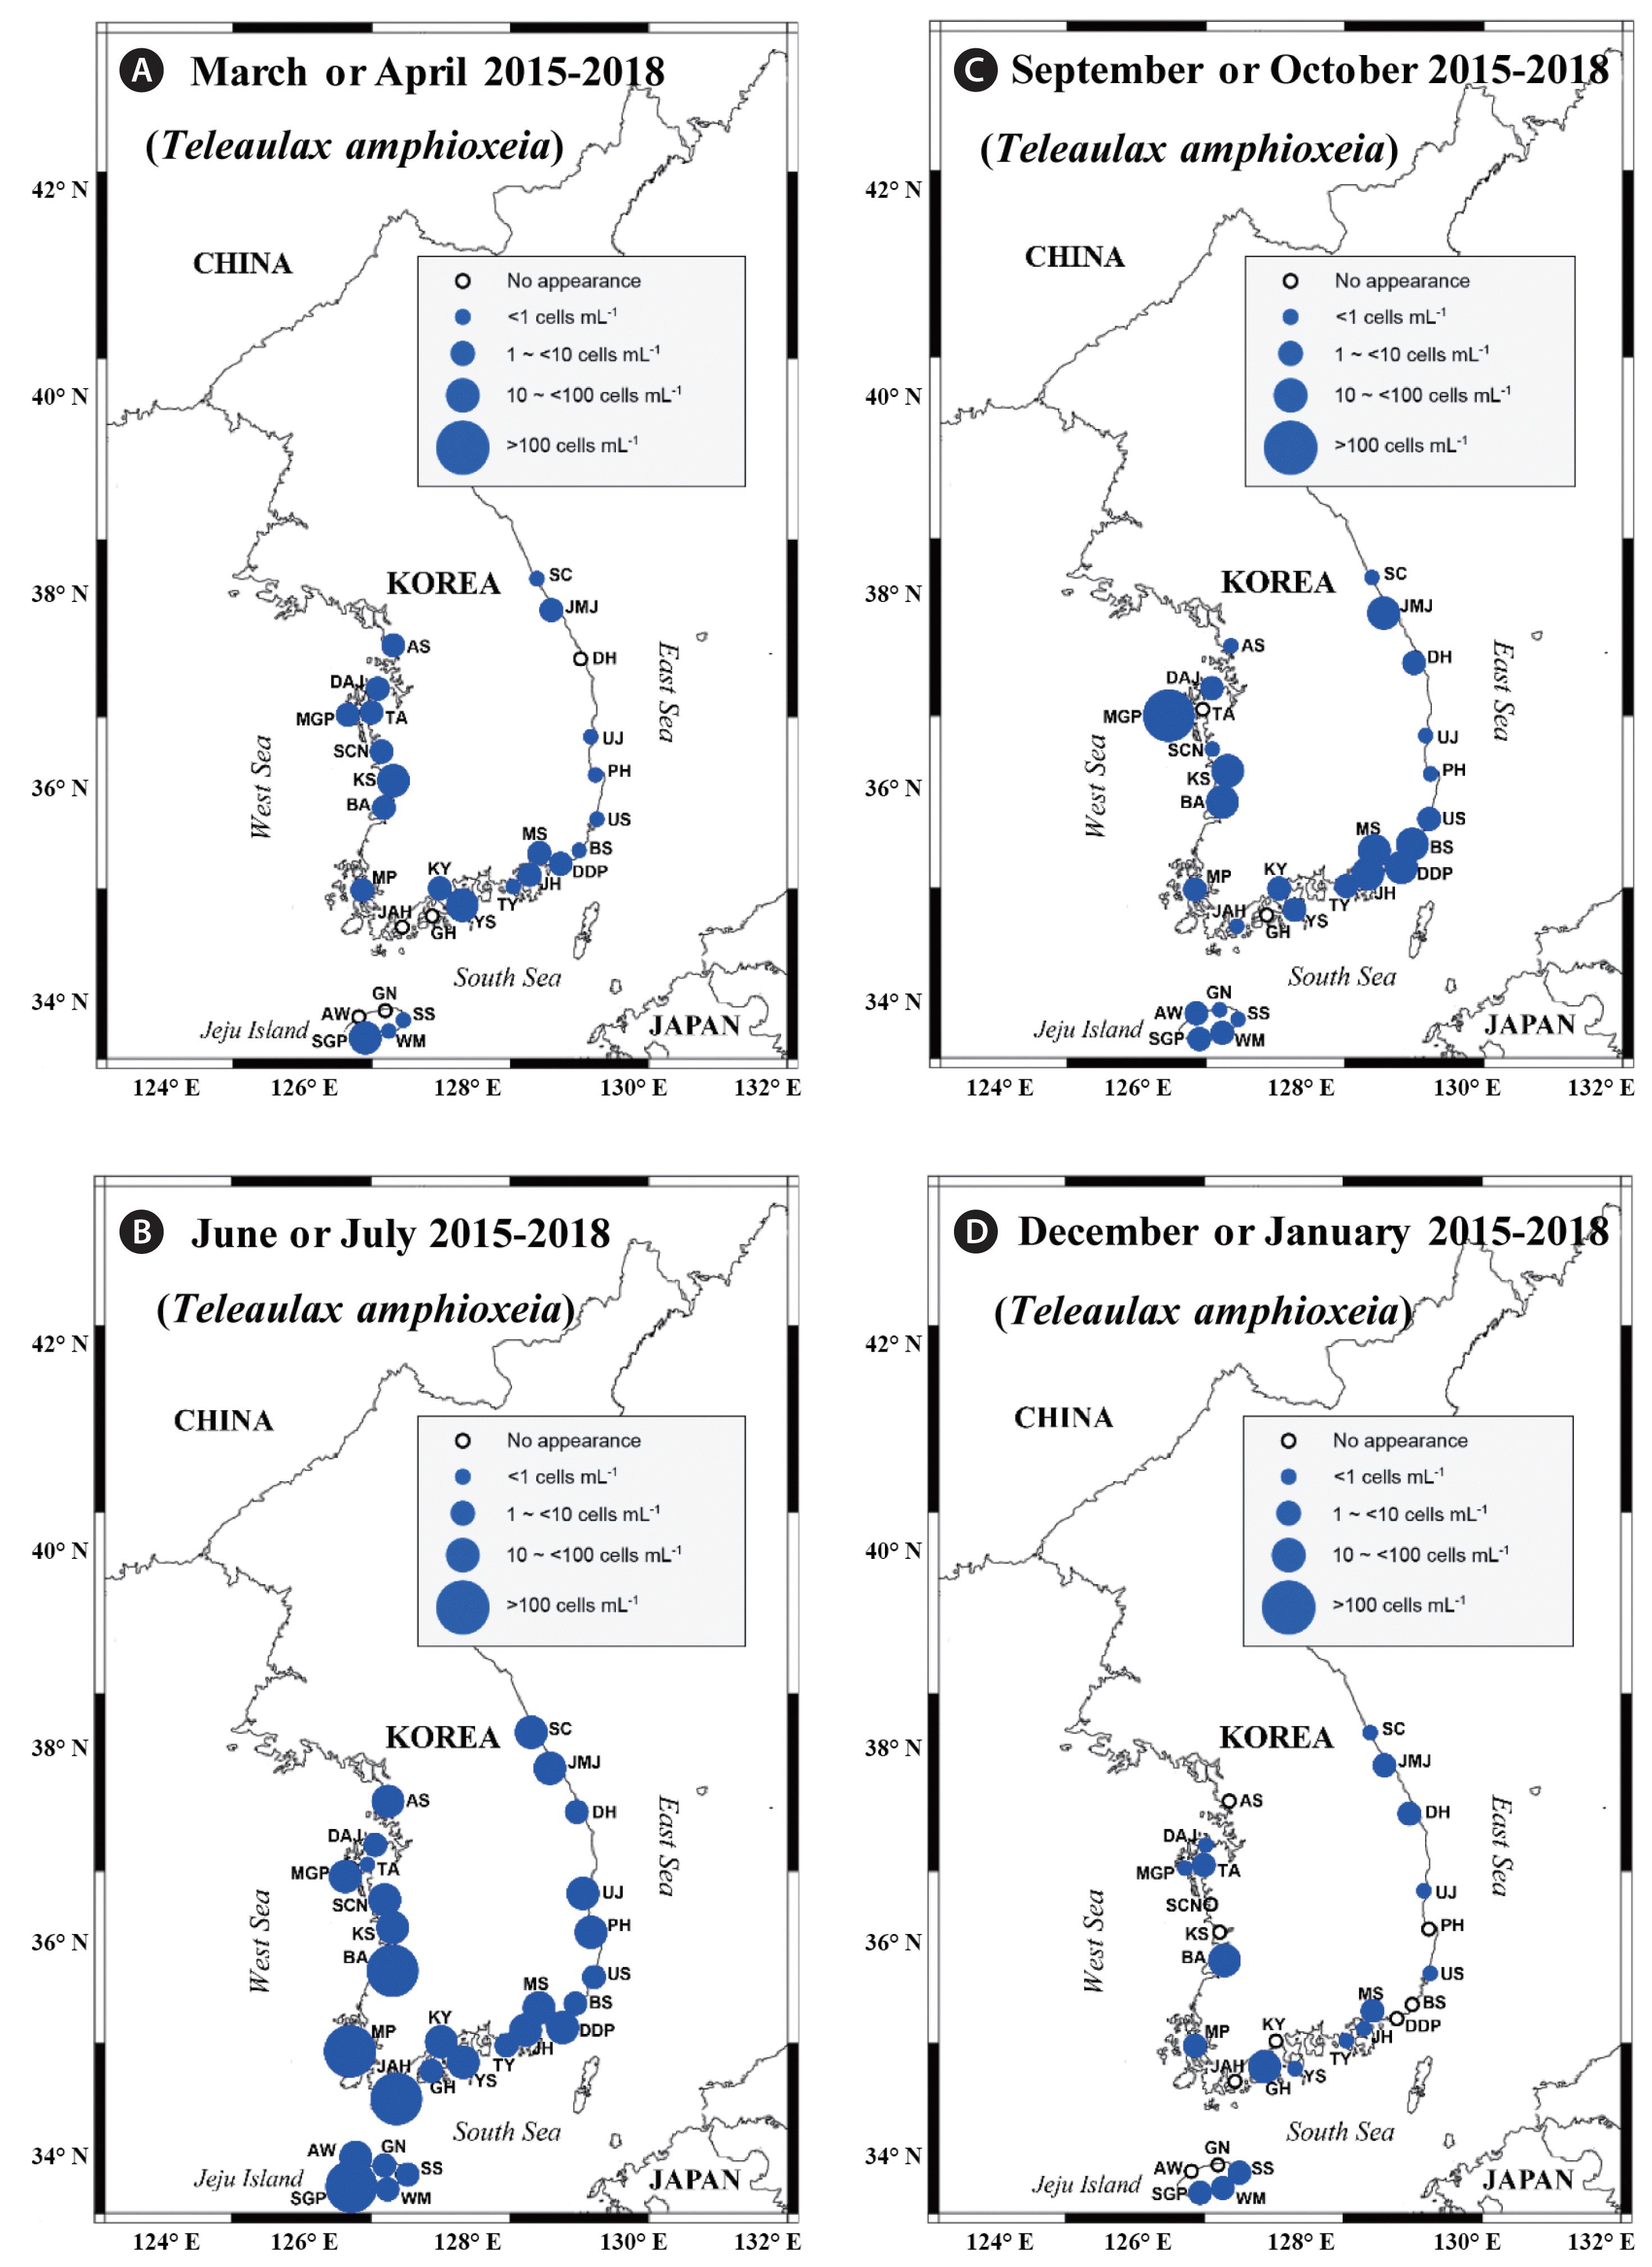
Map of the sampling stations, indicating the presence and absence of Teleaulax amphioxeia in spring (March or April) (A), summer (June or July) (B), autumn (September or October) (C), and winter (December or January) (D) from 2015 to 2018. The blue closed circles indicate the stations at which T. amphioxeia cells were detected, whereas the black open circles indicate the stations at which T. amphioxeia cells were not detected. SC, Sokcho; JMJ, Jumunjin; DH, Donghae; UJ, Uljin; PH, Pohang; US, Ulsan; BS, Busan; DDP, Dadaepo; MS, Masan; JH, Jinhae; TY, Tongyoung; YS, Yeosu; KY, Kwangyang; GH, Goheung; JAH, Jangheung; AS, Ansan; DAJ, Dangjin; MGP, Mageompo; TA, Taean; SCN, Seocheon; KS, Kunsan; BA, Buan; MP, Mokpo; AW, Aewol; SGP, Seogwipo; WM, Wimi; SS, Seongsan; GN, Gimnyeong.
Y. yeosuensis was identified at 22 stations in the summer but only at three stations in the spring and autumn and only one station in winter, showing a strong seasonality (Fig. 2). Furthermore, four of the five highest abundances of Y. yeosuensis were found in the summer (Supplementary Table S2).
Cells of Pyramimonas sp. were found in all four seasons (Fig. 3). However, the five highest abundances of Pyramimonas sp. were found in the summer (Supplementary Table S2). Cells of T. amphioxeia were also found in all four seasons, but four of the five highest abundances of T. amphioxeia were observed in the summer (Fig. 4, Supplementary Table S2).
Hydrographical properties of assessed stations during the study period
During the study period, the water temperatures at all the stations ranged from 0.2 to 28.0°C, while the salinity at all the stations ranged from 0.1 to 35.6 (Table 2). The concentrations of NO3 and PO4 at all the stations ranged from not detectable (ND) to 149.0 μM and from ND to 6.3 μM, respectively, while the concentration of SiO2 ranged from ND to 453.4 μM. The concentration of DO at all the stations ranged from 0.2 to 14.8 mg L−1 (Table 2).

The ranges of the measures of abiotic environmental factors during the study period and when each of Yihiella yeosuensis, Pyramimonas sp., and Teleaulax amphioxeia was detected in the Korean coastal waters from April 2015 to October 2018
During the study period, Y. yeosuensis, Pyramimonas sp., and T. amphioxeia were present in Korean coastal waters when water temperatures were 2.3–28.0, 3.5–27.0, and 1.1–28.0°C, respectively; salinities were 9.9–34.4, 9.9–34.6, and 0.1–35.6, respectively (Fig. 5A–C); concentrations of NO3 were 0.8–91.9, ND-149.0, and ND-118.3 μM, respectively; concentrations of PO4 were 0.1–2.7, ND-6.3, and ND-6.3 μM, respectively; concentrations of SiO2 were 2.1–316.6, ND-453.4, and ND-448.4 μM, respectively (Fig. 5D–F); and concentrations of DO were 1.7–11.3, 0.4–12.5, and 0.2–14.8 mg L−1, respectively.
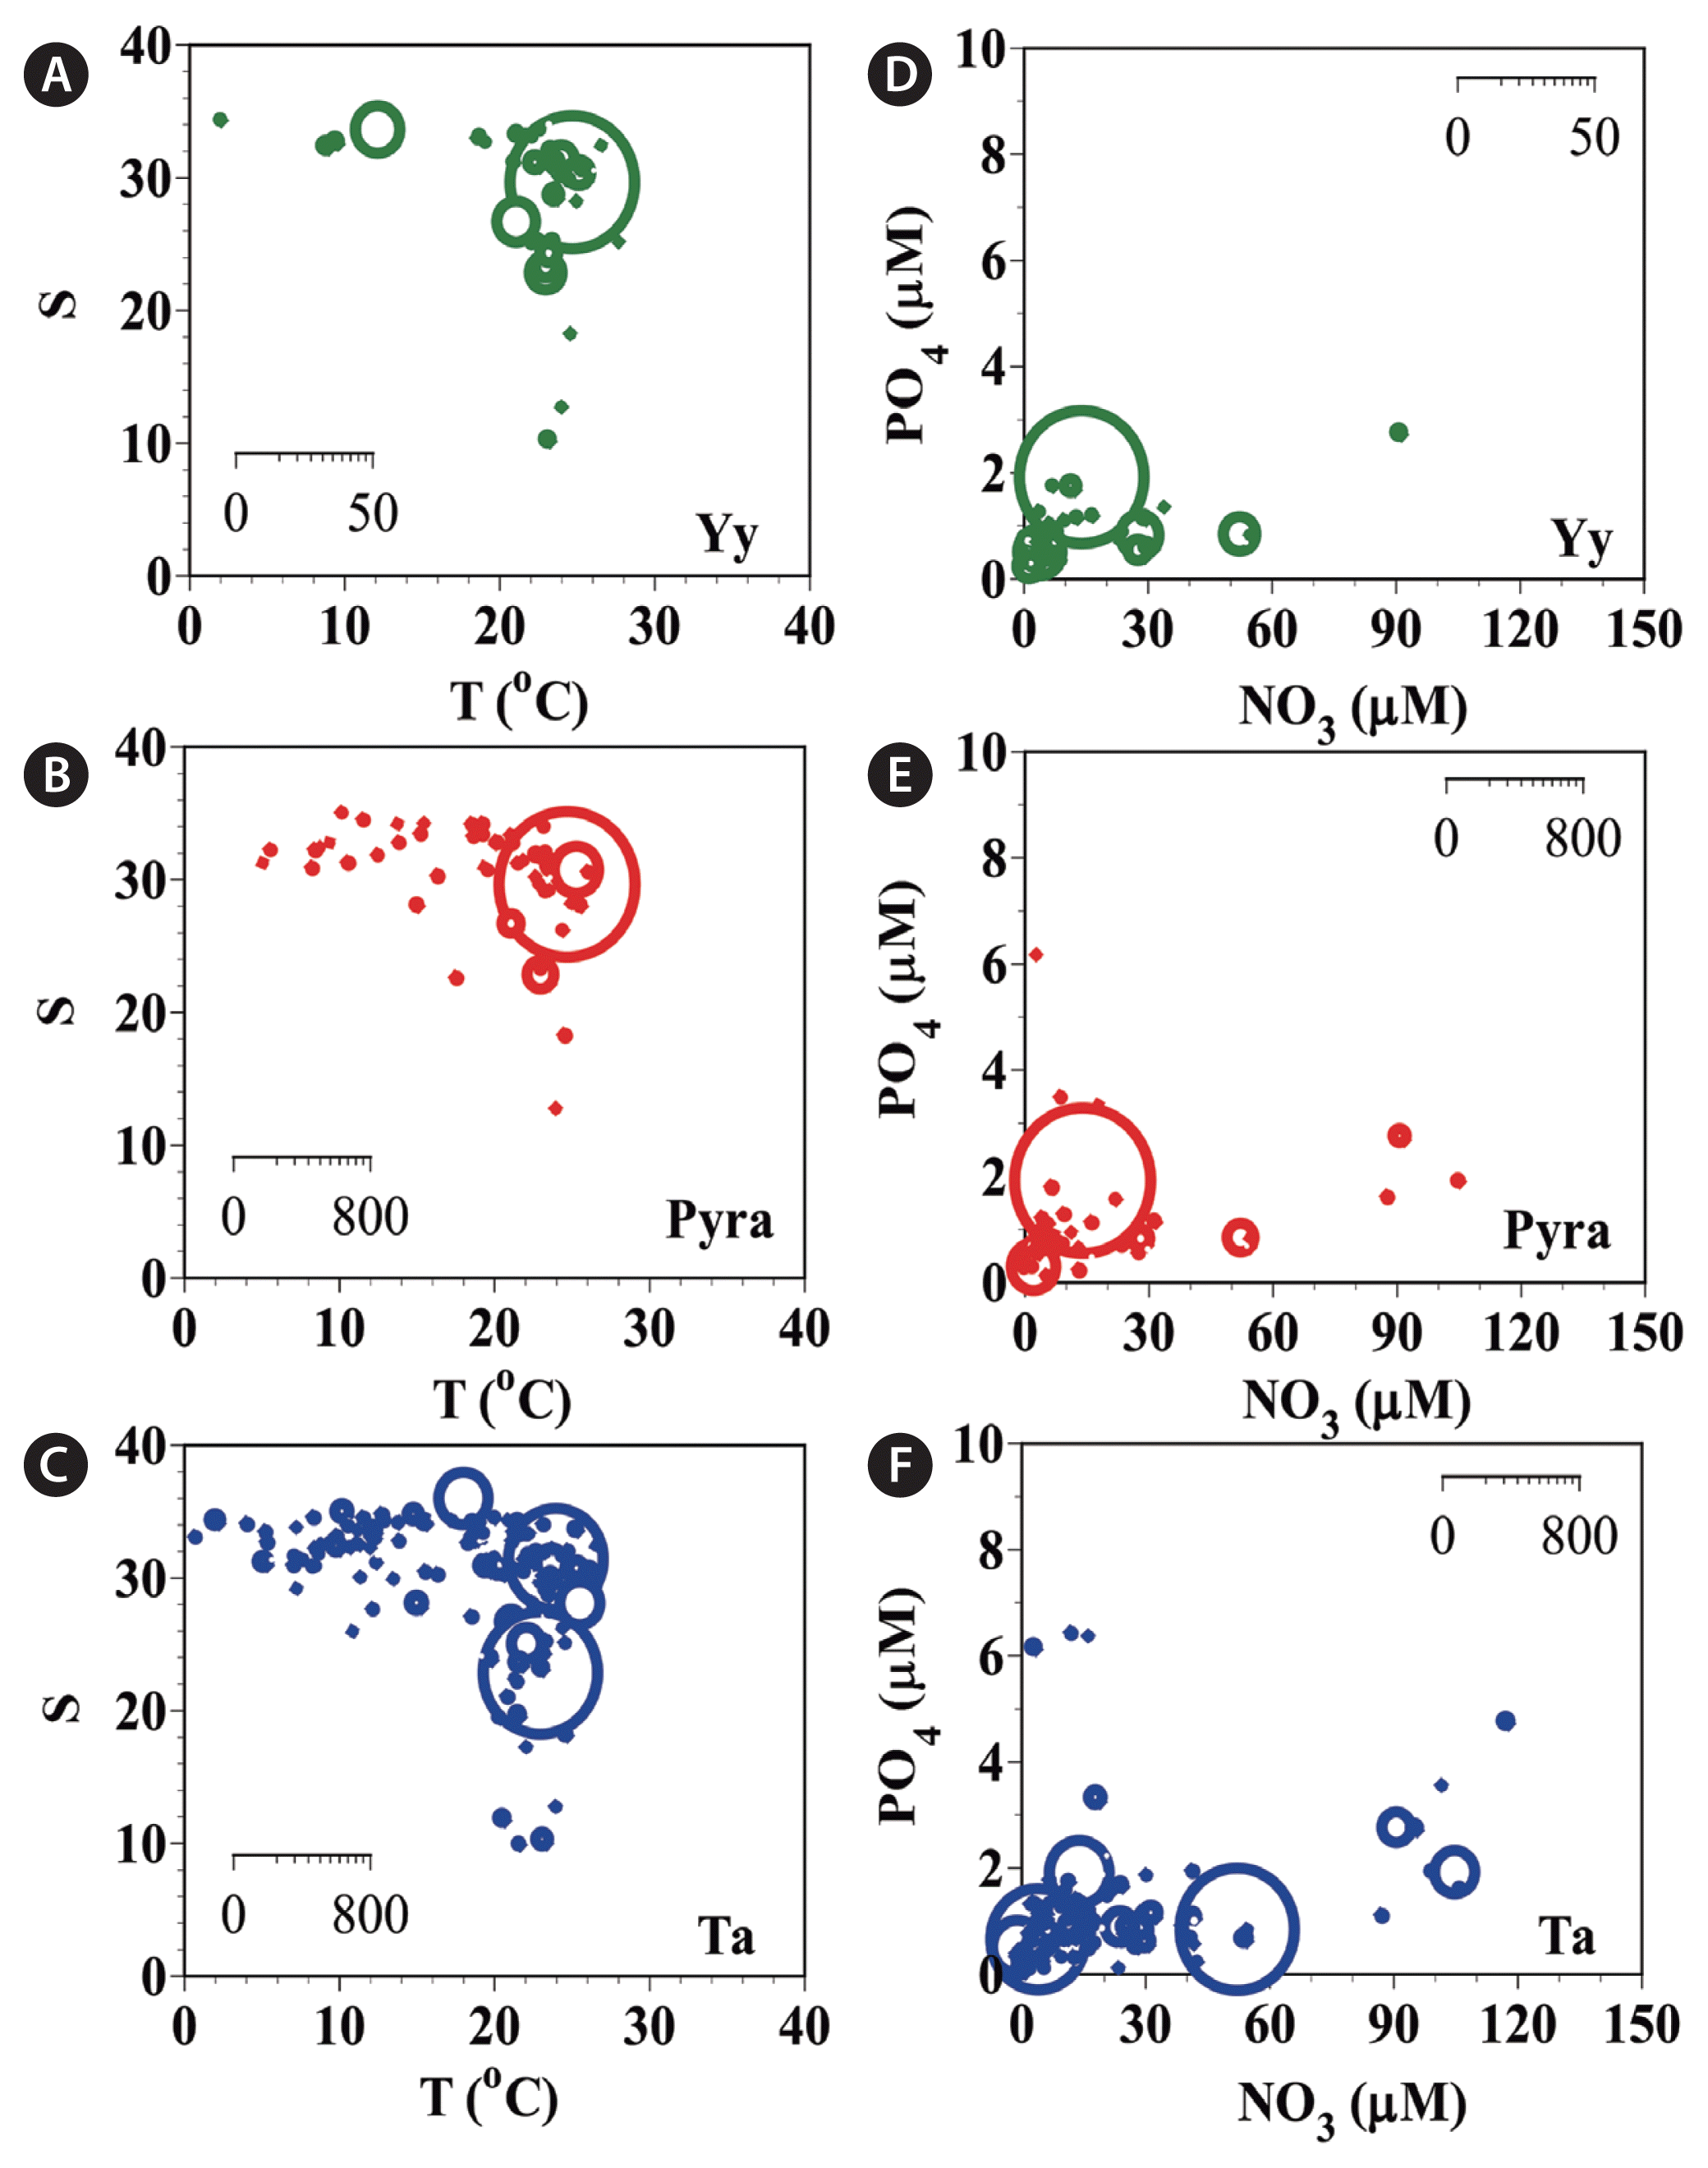
The abundances (cells mL−1) of Yihiella yeosuensis (Yy) (A), Pyramimonas sp. (Pyra) (B), and Teleaulax amphioxeia (Ta) (C) as a function of water temperature (T) and salinity (S) at all stations from 2015–2018 and those of Yy (D), Pyra (E), and Ta (F) as a function of NO3 and PO4 concentrations. The scale of the circles is the abundance of each species (cells mL−1).
Additionally, during the study period, the highest abundances of Y. yeosuensis, Pyramimonas sp., and T. amphioxeia were found when water temperatures were 25.0, 25.0, and 23.3°C, respectively (Fig. 5A–C); salinities were 29.2, 29.2, and 22.4, respectively (Fig. 5A–C); concentrations of NO3 were 15.2, 15.2, and 53.4 μM, respectively; concentrations of PO4 were 1.8, 1.8, and 0.7 μM, respectively; concentrations of SiO2 were 53.5, 53.5, and 300.2 μM, respectively (Fig. 5D–F); and concentrations of DO were 6.1, 6.1, and 7.0 mg L−1, respectively.
Relationships between the abundance of Yihiella yeosuensis and environmental factors
Pearson’s correlation analysis showed that the abundance of Y. yeosuensis was significantly and positively correlated with those of Pyramimonas sp. (p < 0.01, r = 0.968) and T. amphioxeia (p < 0.01, r = 0.352) (Table 3, Fig. 6). Furthermore, the abundance of Y. yeosuensis was significantly and positively correlated with the water temperature (p < 0.05, r = 0.1) (Table 3). However, there were no significant correlations between the abundance of Y. yeosuensis and water salinity, concentrations of nutrients, or DO concentration (Table 3).
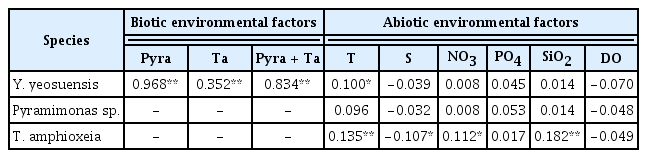
Pearson’s correlation coefficients for the relationships among the abundances of Yihiella yeosuensis (cells mL−1) and its prey species and the relationships between each of these abundances and the abiotic factors during the study period

(A) The abundance (cells mL−1) of Yihiella yeosuensis as a function of the abundances of Pyramimonas sp. and Teleaulax amphioxeia at all the stations from 2015–2018. (B–D) The correlations between the abundance of Y. yeosuensis and those of Pyramimonas sp. (B), T. amphioxeia (C), and T. amphioxeia + Pyramimonas sp. (D) (n = 45). The equations of the curves are as follows: (B) Y. yeosuensis (cells mL−1) = 0.052 (Pyramimonas sp.; cells mL−1) + 0.065, r2 = 0.937; (C) Y. yeosuensis (cells mL−1) = 0.020 (T. amphioxeia; cells mL−1) + 0.112, r2 = 0.124; (D) Y. yeosuensis (cells mL−1) = 0.029 (T. amphioxeia + Pyramimonas sp.; cells mL−1) - 0.048, r2 = 0.696. The scale of the circles in (A) is cells mL−1.
The abundance of Y. yeosuensis was affected mainly by the abundances of Pyramimonas sp. and T. amphioxeia. We further investigated the relationships between environmental factors and the distributions of Pyramimonas sp. and T. amphioxeia. The abundance of T. amphioxeia was significantly and positively correlated with the water temperature and the concentrations of NO3 and SiO2 but was significantly and negatively correlated with salinity (Table 3). However, the abundance of Pyramimonas was not significantly correlated with any of the investigated environmental factors (Table 3).
Grazing impacts of Yihiella yeosuensis on populations of Pyramimonas sp
When the abundances of Pyramimonas sp. and Y. yeosuensis were 0.0–917.6 and 0.0–48.5 cells mL−1, respectively, the calculated grazing coefficients (g) attributable to Y. yeosuensis on the co-occurring Pyramimonas sp. were up to 0.42 d−1 (mean ± standard error = 0.03 ± 0.01 d−1, n = 31) (Fig. 7).

The calculated grazing coefficients (g, n = 31) of Yihiella yeosuensis in relation to the concentration of co-occurring Pyramimonas sp. (see text for calculation). Clearance rates, measured under the conditions indicated by Jang et al. (2017a), were corrected using Q10 = 2.8 (Hansen et al. 1997) because in situ water temperatures obtained in this study and the temperature used in the laboratory by Jang et al. (2017a) (20°C) were occasionally different. The scale of the circles is g (d−1).
DISCUSSION
This study showed that Y. yeosuensis cells are widely distributed in Korean coastal waters. Prior to our study, the presence of Y. yeosuensis had been reported at only one location (34°32′ N, 127°55′ E) (Jang et al. 2017b). Thus, this study extends the latitudinal range in which Y. yeosuensis is present from 34°32′ N to 33°17′-38°12′ N.
During the study period, the ranges of water temperature, salinity, and the concentrations of NO3, PO4, and SiO2 at the stations in which Y. yeosuensis was present were wide. However, the highest abundance of Y. yeosuensis was found in summer when the water temperature was 25.0°C. Meanwhile, the water temperature, salinity, and concentrations of NO3, PO4, and SiO2 at the stations in which Pyramimonas sp. and T. amphioxeia were found also tended to vary widely. However, the highest abundances of these two species were also found in the summer when water temperatures were 23.3–25.0°C. The maximum growth rates of Y. yeosuensis on Pyramimonas sp. and T. amphioxeia (i.e., mixotrophic growth rate) were 1.32 and 1.29 d−1, respectively, but the growth rate of Y. yeosuensis without prey was negligible (Jang et al. 2017a). Thus, Y. yeosuensis was expected to be abundant only when its prey is abundant (Jang et al. 2017a). Significant positive correlations between Y. yeosuensis and Pyramimonas sp. or T. amphioxeia found in this study support this hypothesis. During the study period, the maximum abundance of Pyramimonas sp. was 917.6 cells mL−1 (36.7 ng C mL−1). Simultaneously, the abundance of Y. yeosuensis was also the highest at 48.5 cells mL−1. When the equation of the growth rates of Y. yeosuensis on Pyramimonas sp. as a function of prey concentration given by Jang et al. (2017a) was used, the calculated growth rate of Y. yeosuensis on Pyramimonas sp. at the prey concentration of 36.7 ng C mL−1 was 0.49 d−1. This calculated growth rate is 37% of the maximum growth rate of Y. yeosuensis on Pyramimonas sp. Therefore, the abundance of Pyramimonas sp. determined in this study can support moderate positive growth of Y. yeosuensis. Meanwhile, Y. yeosuensis is known to have an anti-predation behavior, fast-backward jumping, against common heterotrophic protists (Jeong et al. 2018). Thus, in the population dynamics of Y. yeosuensis, its abundance may be mainly affected by prey availability rather than mortality due to predation. In addition, Y. yeosuensis is known to encyst under prey-depletion conditions (Jang et al. 2019). Therefore, to predict the population dynamics of Y. yeosuensis in natural environments, prey abundance should be determined.
This study is the first report regarding the abundance of Pyramimonas sp., belonging to the subgenus Trichocystis, and T. amphioxeia in Korean waters. It is challenging to distinguish Pyramimonas sp. and T. amphioxeia from other species in each genus through light microscopy because their cells are approximately 5–10 μm in length. However, the abundances of these species were quantified in this study by a qPCR method employing species-specific primers and probes. In the global oceans, cells of Pyramimonas spp. have been found at temperatures and salinities of −1.5 to 28°C and 3.8 to 34.7, respectively (Van Valkenburg et al. 1978, Parry et al. 1989, Domingos and Menezes 1998, Andreoli et al. 2000, Bergesch et al. 2008, Stonik 2009, Tas and Yilmaz 2015), and cells of T. amphioxeia have been found at temperatures and salinities of 2.9–25°C and 0.5–34.8, respectively (Schmidt et al. 1998, Hajdu et al. 2007, Johnson et al. 2016, Herfort et al. 2017, Kim et al. 2018). This study extends the ranges of water temperature and salinity in which cells of T. amphioxeia can exist to 1.1–28.0°C and 0.1–35.6, respectively. Thus, there is a distinct possibility that Y. yeosuensis encounters Pyramimonas sp. and T. amphioxeia in the global oceans. However, the threshold Pyramimonas sp. concentration for the positive growth of Y. yeosuensis is 3.18 ng C mL−1 (79.5 cells mL−1). The maximum growth and ingestion rates of Y. yeosuensis for T. amphioxeia were similar to those for Pyramimonas sp. (Jang et al. 2017a). This indicated that the threshold T. amphioxeia concentration for the positive growth of Y. yeosuensis is likely to be similar to the threshold Pyramimonas sp. concentration. In our study, there were three water samples in which the biomass of Pyramimonas sp. exceeded 3.18 ng C mL−1 and three water samples in which the biomass of T. amphioxeia exceeded 3.18 ng C mL−1. In addition, there were five water samples in which the combined biomass of Pyramimonas sp. and T. amphioxeia exceeded 3.18 ng C mL−1. Thus, Y. yeosuensis may have difficulty in encountering Pyramimonas sp. or T. amphioxeia with a biomass exceeding 3.18 ng C mL−1 in Korean waters. There are yet to be studies on red tides or blooms due to Y. yeosuensis. Low biomasses of the only prey species of Y. yeosuensis, Pyramimonas sp. and T. amphioxeia, are likely to limit the population of Y. yeosuensis.
Our molecular analysis showed that the strain of Pyramimonas sp., PSSH1204, used in this study belongs to the subgenus Trichocystis. The maximum abundances of Pyramimonas spp. belonging to the subgenus Trichocystis in the brackish Patterson Lakes of Australia (300,000 cells mL−1) (McFadden et al. 1986) and the estuary of the Marmara Sea, Turkey (1,600 cells mL−1) (Tas and Yilmaz 2015) are greater than that of Pyramimonas sp. recorded in this study (918 cells mL−1). Thus, if Y. yeosuensis is present in these waters, its maximum abundance may be higher than that found in the present study.
The maximum grazing coefficients (g) of Y. yeosuensis on the co-occurring Pyramimonas sp. was 0.42 d−1 (i.e., up to 35% of the Pyramimonas sp. population was consumed in 1 d). Therefore, Y. yeosuensis may sometimes have considerable grazing impacts on populations of Pyramimonas sp. Thus, we conclude that the spatio-temporal distributions of Y. yeosuensis in the Korean coastal waters may affect and also be affected by those of its optimal prey species.
SUPPLEMENTARY MATERIALS
List of species used to determine primer specificity, and quantitative real-time PCR (qPCR) results (https://e-algae.org).
Abundance (cells mL−1) of Yihiella yeosuensis (Yy), Teleaulax amphioxeia (Ta), and Pyramimonas sp. (Pyra) at each sampling station from April 2015 to October 2018 (https://e-algae.org).
ACKNOWLEDGEMENTS
We thank An Suk Lim, Sung Yeon Lee, Jin Hee Ok, Hee Chang Kang, Ji Hyun You, Ji Eun Kwon, and So Jin Kim for technical supports. This work was supported by the Useful Dinoflagellate Program of Korea Institute of Marine Science and Technology Promotion (KIMST) funded by the Ministry of Oceans and Fisheries (MOF) and the National Research Foundation (NRF) funded by the Ministry of Science and ICT (NRF-2015M1A5A1041806; NRF-2017R1E1A1A01074419) award to HJJ.