Optimal filter materials for protist quantification via droplet digital PCR
Article information

Abstract
The use of droplet digital polymerase chain reaction (ddPCR) has greatly improved the quantification of harmful protists, outperforming traditional methods like quantitative PCR. Notably, ddPCR provides enhanced consistency and reproducibility at it resists PCR inhibitors commonly found in environmental DNA samples. This study aimed to determine the most effective filter material for ddPCR protocols by assessing the reproducibility of species-specific gene copy numbers and filtration time across six filter types: cellulose acetate (CA), mixed cellulose ester (MCE), nylon (NY), polycarbonate (PC), polyethersulfone (PES), and polyvinylidene fluoride (PVDF). The study used two species of Chattonella marina complexes as a case study. Filtration rates were slower for NY, PC, and PVDF filters. Moreover, MCE, NY, PES, and PVDF yielded lower DNA amounts than other filters. Importantly, the CA filter exhibited the lowest variance (38–39%) and the highest determination coefficients (R2 = 0.92–0.96), indicating superior performance. These findings suggest that the CA filter is the most suitable for ddPCR quantification of marine protists, offering quick filtration and reliable reproducibility.
INTRODUCTION
In recent years, environmental DNA (eDNA) has been used to significantly advance marine plankton monitoring through advanced molecular techniques. Notably, droplet digital polymerase chain reaction (ddPCR) has emerged as an innovative tool for quantifying harmful algal populations, as demonstrated in studies by Lee et al. (2017, 2020) and Min and Kim (2022). The ability of ddPCR to accurately target and count specific marine protist species using eDNA represents clear benefits over traditional PCR and quantitative PCR (qPCR) methods. It is especially effective for determining cell counts of unicellular organisms, including those causing harmful algal blooms such as Cochlodinium polykrikoides and Alexandrium, by using specifically designed short DNA sequences for detection (Lee et al. 2017, 2000).
The ddPCR technique divides the PCR mixture into thousands of nanoliter-sized droplets, each acting as an individual reaction chamber. After amplification, the droplets are analyzed to quantify the targeted DNA sequence copies. This method offers more accurate and detailed cell counts than microscopy, proving crucial for quickly and reliably monitoring harmful protists, even at low cell abundances.
The extrapolation of eDNA concentrations to actual population sizes in aquatic environments is challenging due to variability and methodological biases. These biases include sample collection, filtration, DNA extraction, and the presence of PCR inhibitors (Harrison et al. 2019). To make eDNA a more effective and reliable population monitoring tool, it’s essential to address these factors (Reid et al. 2019). Moreover, the type of filter and extraction method used influences the efficacy of DNA recovery from environmental samples. Previous studies have shown that filter materials like nitrocellulose and polyvinylidene fluoride (PVDF) typically yield higher DNA quantities than polycarbonate (PC) and glass fiber filters (GFF), regardless of extraction methods used (Djurhuus et al. 2017, Majaneva et al. 2018).
This study aims to address the methodological uncertainties in marine eDNA analysis by evaluating the impact of various filter materials on the detection of the genetic marker. We compare six filter materials—cellulose acetate (CA), mixed cellulose ester (MCE), nylon (NY), PC, polyethersulfone (PES), and PVDF. All have a uniform pore size of 0.45 μm, and we use them in conjunction with an alkaline lysis extraction method. The research outcomes will help establish guidelines for choosing the most suitable filter materials for ddPCR protocols. These protocols are optimized for accurate quantification of harmful protists. We assess the performance of these filter materials in the ddPCR quantification of eDNA from unialgal cultures of C. marina and C. ovata, with the goal of enhancing the reliability of protist population assessments.
MATERIALS AND METHODS
This study was designed to determine the most efficacious filter material for the ddPCR-based quantification of harmful protists, specifically C. marina and C. ovata (Raphidophyceae).
Cell suspensions with precise cell counts of the two species were filtered through six type of 47 mm diameter filter membranes: CA (0.45 μm, C045A047; ADVANTEC, Tokyo, Japan), MCE (0.45 μm, HAWP04700; Millipore, Billerica, MA, USA), NY (0.45 μm, HNWP04700; Millipore), PC (0.4 μm, HTTP04700; Millipore), PES (0.45 μm, HPWP04700; Millipore), and PVDF (0.45 μm, HVLP04700; Millipore). The choice to exclude GFF (0.7 μm, 1825-047; Whatman, Maidstone, UK) was based on their previously documented low genomic DNA yield, despite high cell retention capacity (Lee et al. 2017). Evaluation criteria included both filtration duration and reproducibility of species-specific gene copy numbers.
DNA was isolated using a two-step lysis protocol established by Lee et al. (2017). Mechanical disruption of cells on filters was performed by bead-beating with 2 mm zirconia beads, followed by a lysis phase at 95°C using a lysis buffer. Neutralization was subsequently achieved with Tris-HCl, with the supernatant serving as the template for ddPCR.
ddPCR quantification was conducted using a QX200 system (Bio-Rad Laboratories Inc., Hercules, CA, USA), adhering to the manufacturer’s guidelines. The ddPCR mixture, with a total volume of 20 μL, included EvaGreen Supermix, primers specific to the internal transcribed spacer (ITS) regions of Chattonella (Min and Kim 2022), and the DNA template. The reaction was executed in approximately 20,000 droplets per sample, with thermal cycling performed on a T100 Thermal Cycler (Bio-Rad Laboratories Inc.). Analysis of droplets post-PCR was carried out using a QX200 Droplet Reader and QuantaSoft software (Bio-Rad Laboratories Inc.) for target DNA quantification, applying Poisson statistic for calculation (Pinheiro et al. 2012).
To determine the reproducibility of species-specific copy numbers, the coefficient of determination (R2) was calculated from linear regression analyses, correlating added cell counts to detected gene copies. The coefficient of variance (CV) was calculated to measure variability among gene copy numbers. Differences across filter types were statistically assessed using the Kruskal-Wallis H test, and significant findings were further investigated with post-hoc pairwise comparisons via the Wilcoxon sum rank test with Bonferroni adjustment. Statistical procedures were implemented in R using the ‘stats’ package v4.1.2 (R Core Team 2021).
RESULTS
While filtration time were not explicitly measured, filters composed of NY, PC, and PVDF demonstrated noticeably slower filtration rates during the processing of one liter of seawater. These observations are consistent with the manufacturer’s specifications regarding water flow rates (Table 1).

The features of various types of membrane filters offered on their manufacturers, including the glass fiber
Analysis of species-specific gene copy numbers via ddPCR revealed significant variances contingent of the type of filter materials employed, as depicted in Figs 1 & 2. The employment of CA and PC filters led to the highest ITS gene copy numbers per cell in both species of Chattonella. Specifically, CA and PC filters yielded 25 ± 1 and 148 ± 43 copies for C. marina, and 112 ± 7 and 88 ± 17 copies for C. ovata, respectively (Table 2, Fig. 2). In contrast, MCE, NY, PES, and PVDF filters produced substantially lower gene copy numbers (Figs 1 & 2).
The specific copy number of internal transcribed spacer (ITS) DNA fragments of Chattonella marina (A–F) and C. ovata (G–L) measured by droplet digital polymerase chain reaction with varying cell counts on six different filter materials: cellulose acetate (CA) (A & G), mixed cellulose ester (MCE) (B & H), nylon (NY) (C & I), polycarbonate (PC) (D & J), polyether sulfone (PES) (E & K), and polyvinylidene fluoride (PVDF) (F & L). The solid lines presented the linear correlation between cell counts and total ITS copy number in the samples.
A comparison of the specific copy numbers of internal transcribed spacer (ITS) DNA fragments of Chattonella marina (A) and C. ovata (B) across six different filter materials, measured by droplet digital polymerase chain reaction. The specific copy number along filter materials differed based on the Kruskal-Wallis H test (p < 0.001). Small letters indicate post hoc multiple comparison results based on the Bonferroni test. The filter materials are as follows: CA, cellulose acetate; MCE, mixed cellulose ester; NY, nylon; PC, polycarbonate; PES, polyether sulfone; PVDF, polyvinylidene fluoride.
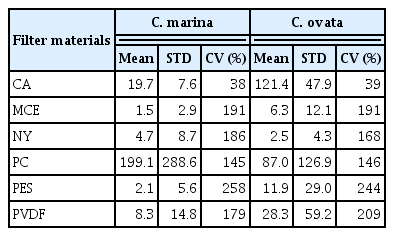
The statistics of species-specific copy number for two Chattonella species, depending on the type of filter materials used
The CA filter exhibited the least variability in gene copy numbers, as evidenced by the lowest CV (38% for C. marina and 39% for C. ovata) and the greatest consistency, indicated by the highest coefficient of determination (R2 = 0.92 for C. marina and R2 = 0.96 for C. ovata) (Table 2, Fig. 1). These results suggest that the CA filter is highly reliable for the measurement of gene copy numbers in ddPCR assays.
DISCUSSION
During the advent of ddPCR technology, considerations regarding the effect of filter material choice on DNA recovery and the accuracy of the assay were not fully addressed, as emphasized by Lee et al. (2017). It is well-established that the filtration step is critical in DNA-based methodologies such as eDNA metabarcoding and qPCR quantification, as it can markedly impact the results (Liang and Keeley 2013, Djurhuus et al. 2017, Majaneva et al. 2018). Despite the proven reproducibility of ddPCR, variations in DNA yield attributable to different filters can affect the DNA concentration available for reaction, thus influencing the reproducibility of the assay (Devonshire et al. 2015, Lee et al. 2017).
Choosing the appropriate filter is contingent upon the nature the DNA (e.g., cellular or extracellular) and the subsequent analyses planned. The ddPCR protocol employs an alkaline lysis procedure that avoids tube replacement, allowing the filter to remain in contact with the DNA throughout the extraction process. This is designed to target cellular DNA, providing a precise estimate of live cell abundance. Nonetheless, certain materials such as glass fiber, cellulose nitrate, and acetate may be theoretically less suitable for ddPCR, potentially acting as electron donors and interfering with DNA integrity in solution (Van Oss et al. 1987).
The process of eDNA recovery from environmental water samples is inherently more complex than that of laboratory sample preparation. Factors such as pH, organic and inorganic particles, and filter pore size are critical in determining the ultimate DNA yield (Liang and Keeley 2013, Spens et al. 2017). Moreover, eDNA is susceptible to degradation under higher temperatures and UV exposure, which can be mitigated by prompt on-site filtration to minimize eDNA decay and ensure maximal recovery of DNA fragments (Pilliod et al. 2014, Stickler et al. 2015, Majaneva et al. 2018).
The formulation of new quantitative or detection method involving eDNA must involve a critical assessment of DNA yields in relation to filter types, considering the entirety of DNA handling process from sampling through to extraction. Our results suggest that CA filter is preferable, attributing to its fast filtration capability and enhanced reproducibility, making it more reliable than other filter options in ddPCR assays.
ACKNOWLEDGEMENTS
This research was supported by a National Research Foundation (NRF) grant funded by the Korean government (MSIT) (NRF-2016R1A6A1A03012647, NRF-2020R1A2C3005053, NRF-2022M3I6A1085991) to KYK.
Notes
Kwang Young Kim serves as an editor for the ALGAE, but has no role in the decision to publish this article. The remaining author has declared no conflicts of interest.
Abbreviations
CA
cellulose acetate
CV
coefficient of variance
ddPCR
droplet digital polymerase chain reaction
eDNA
environmental DNA
GFF
glass fiber filters
ITS
internal transcribed spacer
MCE
mixed cellulose ester
NY
nylon
PC
polycarbonate
PES
polyethersulfone
PVDF
polyvinylidene fluoride
qPCR
quantitative polymerase chain reaction