


INTRODUCTION
Dinoflagellates are one of the major eukaryotic microorganism groups in marine ecosystems and are ubiquitously present from the equator to the polar (Taylor et al. 2008, Jeong et al. 2021a). They have three major trophic modes: autotrophy, mixotrophy, and heterotrophy (Hansen 1991b, Schnepf and Elbrächter 1992, Jeong et al. 2010a, Stoecker et al. 2017). Thus, they play diverse ecological roles, such as primary producers, prey, predators, symbionts, and parasites (Hansen 1991a, Coats 1999, Stat et al. 2008, Jeong et al. 2010b, Fraga et al. 2012, You et al. 2020). They often dominate protist assemblages and cause red tides or harmful algal blooms (Hallegraeff 1993, Smayda and Reynolds 2003, Jeong et al. 2013, Ok et al. 2021b). Furthermore, phototrophic (autotrophic and mixotrophic) dinoflagellates are known to have the largest portion of the annual integrated carbon retention of plankton in Masan Bay, Korea (Jeong et al. 2021b). Therefore, to understand the structure and function of marine ecosystems, the distribution of dinoflagellates in the sea and their ecological roles should be explored.
To predict the distribution of dinoflagellates in the sea, its abundance in different regions and environmental factors affecting the abundance should be determined (Bockstahler and Coats 1993, Li et al. 2000, Jeong et al. 2015, Hernández-Becerril et al. 2018, Lee et al. 2019a, 2019b, Ok et al. 2019, Kang et al. 2020). The distribution of dinoflagellates is affected by diverse abiotic factors, such as water temperature, salinity, and nutrient concentrations (Drira et al. 2008, Cohu et al. 2011, Kang et al. 2019, Lee et al. 2021). Furthermore, biotic factors, such as the abundance of prey, predators, and competitors, affect the distribution of dinoflagellates (Tillmann and Reckermann 2002, Matsubara et al. 2007, Jeong et al. 2015). The distribution of autotrophic dinoflagellates is known to be primarily affected by light, nutrient concentrations, water temperature, and predators (Booth and Smith 1997, Gímez et al. 2011, Jeong et al. 2015, Golubkov et al. 2019), whereas that of heterotrophic dinoflagellates is affected by prey and predators (Verity et al. 1993, Jeong 1999, Jeong et al. 2010b, Kim et al. 2013). The distributions of mixotrophic dinoflagellates are mainly affected by prey, light, nutrient concentrations, water temperature, and predators (Bockstahler and Coats 1993, Smalley and Coats 2002, Baek et al. 2008a, 2008b, Jeong et al. 2013, 2015, Yoo et al. 2013, Ok et al. 2017, Golubkov et al. 2019, Jang and Jeong 2020, Eom et al. 2021). Some heterotrophic dinoflagellates conduct photosynthesis using the plastids of ingested prey and are called kleptoplastidic dinoflagellates (Larsen 1988, Schnepf 1992, Schnepf and Elbrächter 1992, 1999, Skovgaard 1998, Gast et al. 2007, Raven et al. 2009, Johnson 2011, Hehenberger et al. 2019). Previous studies have investigated the distribution of only a few kleptoplastidic dinoflagellates such as Dinophysis spp., Pfiesteria piscicida, and Gymnodinium smaydae (Jeong et al. 2006, Lin et al. 2006, Díaz et al. 2011, Lee et al. 2020). However, the distribution of more kleptoplastidic dinoflagellates, environmental factors affecting their distributions, and eco-evolutionary strategies need to be investigated.
Recently, a kleptoplastidic dinoflagellate, Shimiella gracilenta, has been described (Ok et al. 2021a). This dinoflagellate was originally named Gymnodinium gracilentum until recently established as S. gracilenta based on molecular and electron microscopic analyses (Campbell 1973, Ok et al. 2021a). To date, some ecophysiological characteristics of S. gracilenta have been investigated (Skovgaard 1998, Jakobsen et al. 2000, Park et al. 2021); light provided positive effects on the growth and ingestion of S. gracilenta under food-repleted conditions using kleptoplastids and enhanced the survival of S. gracilenta under food-depleted conditions (Skovgaard 1998); moreover, the growth rate of S. gracilenta was saturated at a light intensity of 60–80 μmol photons m−2 s−1 (Jakobsen et al. 2000). Interactions between S. gracilenta and heterotrophic protists have been recently explored. Shimiella gracilenta has only a few heterotrophic protistan predators but supports moderate growth rates of the predators (Park et al. 2021). However, spatial and temporal distributions of S. gracilenta, abiotic and biotic factors affecting the distribution, and the numerical and functional responses of S. gracilenta to prey concentration have not yet been explored.
Cells of S. gracilenta are <13 μm in length and fragile due to lack of theca (Ok et al. 2021a). Some dinoflagellates belonging to Gymnodiniales (e.g., Gymnodinium minutulum and Gymnodinium octo) are morphologically similar to S. gracilenta (Campbell 1973, Larsen 1994), making it difficult to distinguish S. gracilenta from other dinoflagellate species in fixed samples under light microscopes. Thus, to quantify the abundance of S. gracilenta, molecular techniques such as quantitative real-time polymerase chain reaction (qPCR) should be used.
In the present study, the abundance of S. gracilenta was quantified at 28 coastal stations along the Korean Peninsula and Jeju Island during four seasons from April 2015 to October 2018, using a qPCR with a newly developed primer-probe set of S. gracilenta. Seawaters from the 28 stations have a wide range of water temperatures, salinities, and nutrient concentrations due to the temperate climate and freshwater input from large rivers (Kang et al. 2019, Lee et al. 2019b). Thus, these stations are ideal regions for exploring the environmental factors affecting the distribution of S. gracilenta. Correlations between the abundance of S. gracilenta and water temperature, salinity, dissolved oxygen (DO), and the concentrations of nutrients and chlorophyll-a (Chl-a) were explored. Furthermore, to investigate the effects of biotic factors on the distribution of S. gracilenta, the prey species that S. gracilenta is able to feed on and growth and ingestion rates of S. gracilenta on suitable prey species as a function of prey concentration were determined. Using the data on the abundance of prey species in the literature (Jang and Jeong 2020) and the data on the abundance of S. gracilenta in the present study, the correlations between the abundance of S. gracilenta and each prey species were explored. The results of the present study provide a basis for understanding the distribution of kleptoplastidic dinoflagellates and biotic and abiotic environmental factors affecting their distribution.
MATERIALS AND METHODS
Field sample collection during 2015–2018
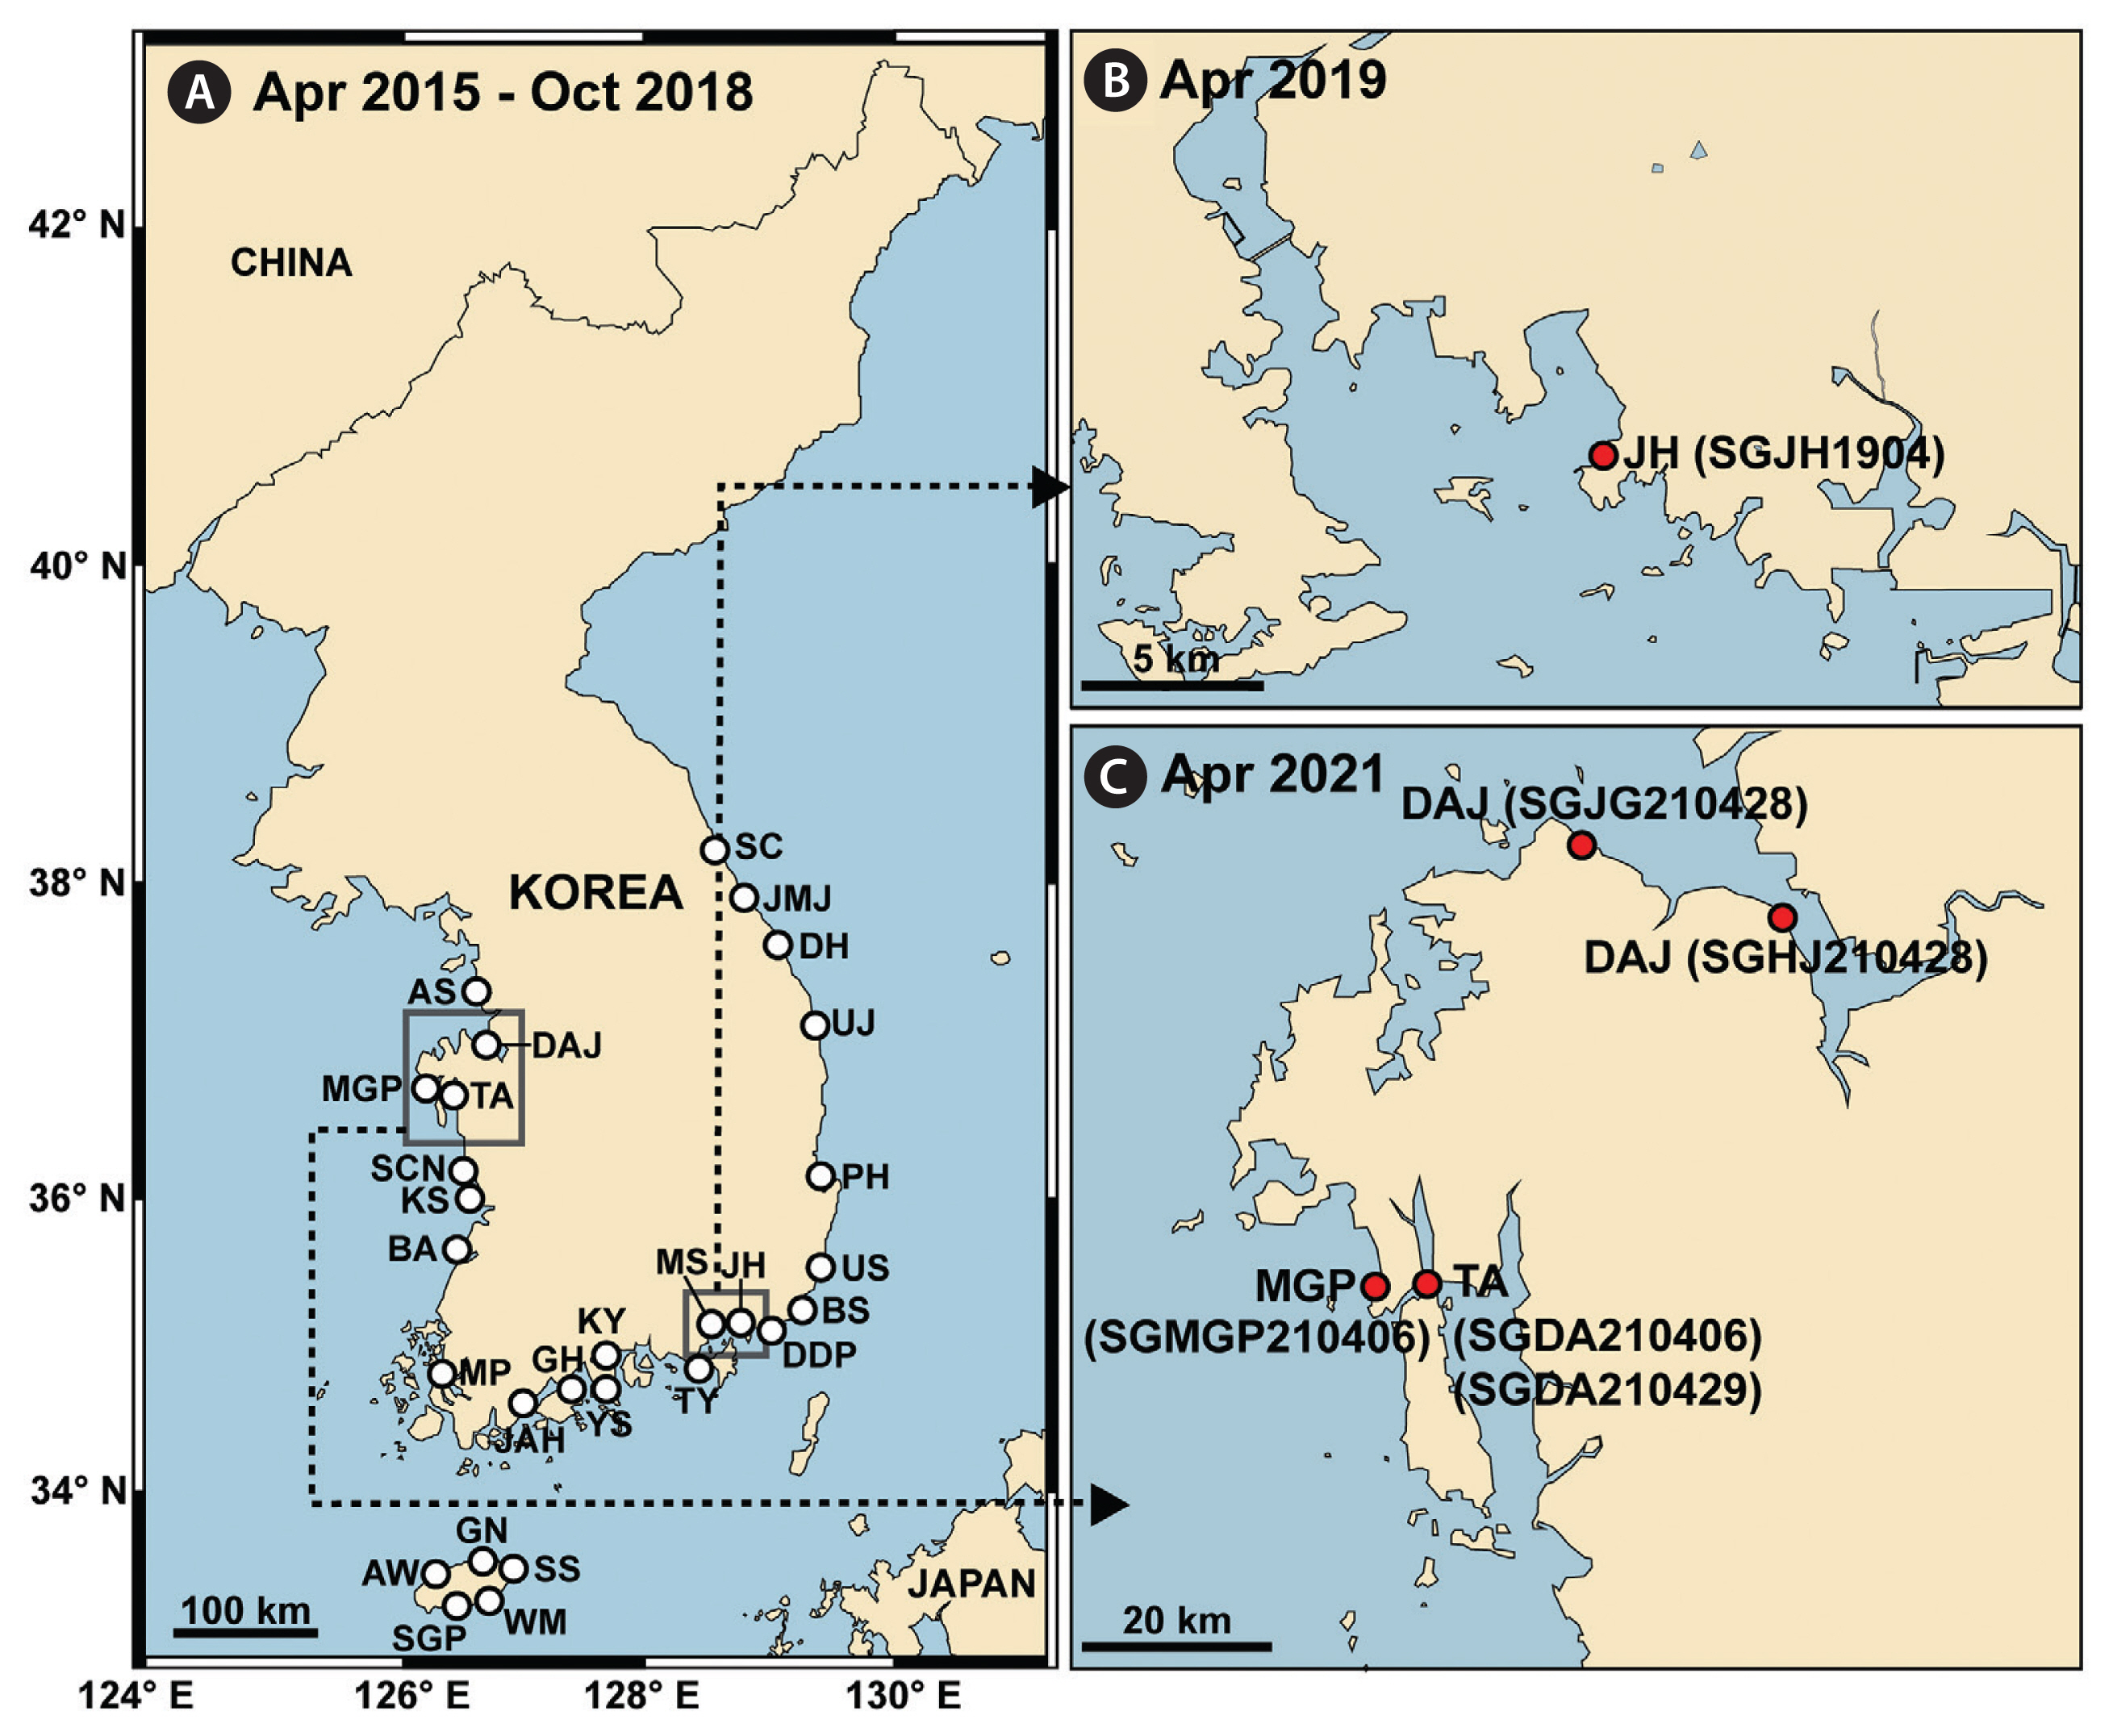
Surface water samples were collected from 28 stations along the Korean Peninsula (East, West, and South Seas) and Jeju Island during 2015–2018 (Fig. 1A). These samples were collected seasonally between April 2015 and October 2018 (Supplementary Table S1).
Data on the water temperature, salinity, DO, Chl-a concentration, and the concentration of nitrite plus nitrate (NO2 + NO3, hereafter NO3), phosphate (PO4), and silicate (SiO2) of seawater at 28 stations during the study period were obtained from our previous studies (Kang et al. 2019, Lee et al. 2019b).
For qPCR analysis, 40–600 mL of seawater was filtered through 25-mm GF/C filters (Whatman Inc., Clifton, NJ, USA). The filtered membrane was stored in a 2.0-mL tube and frozen at −20°C until transfer to the laboratory. DNA from the filtered membrane was extracted using the AccuPrep Genomic DNA Extraction Kit (Bioneer, Daejeon, Korea).
Culture of Shimiella gracilenta
Shimiella gracilenta SGJH1904 was isolated from a water sample collected from surface water off Jinhae Bay, Korea, in April 2019, when water temperature and salinity were 14.6°C and 33.6, respectively (Fig. 1B) (Ok et al. 2021a). The clonal culture of this dinoflagellate was established using two consecutive single-cell isolations, and the cryptophyte Teleaulax amphioxeia was provided as prey every 3–4 days (30,000–50,000 cells mL−1). The clonal culture in a 250-mL cell culture flask was placed on a shelf at 20°C under a 14 : 10 h light : dark cycle and 20 μmol photons m−2 s−1 of cool white fluorescent light.
Species-specific primer and probe design and specificity analysis
To develop a species-specific primer and probe set for S. gracilenta, the sequences of the internal transcribed spacer region of ribosomal DNA (ITS rDNA) of S. gracilenta SGJH1904 and other dinoflagellate species belonging to the family Kareniaceae and related dinoflagellate species were obtained from GenBank (Supplementary Table S2). These sequences were aligned using MEGA v.4 (Tamura et al. 2007). The unique part of the ITS rDNA sequences for S. gracilenta was searched from the alignments to develop the S. gracilenta-specific primers and probe. The primer and probe sequences were analyzed using Primer 3 (Whitehead Institute for Biomedical Research, Cambridge, MA, USA) and Oligo Calc: Oligonucleotide Properties Calculator (Kibbe 2007) to determine the optimal melting temperature and secondary structure, respectively. The primers and probe were synthesized by Bioneer (Table 1). The probe was dual-labeled with the fluorescent dyes FAM and BHQ1 at the 5′ and 3′ ends.
Specificity analysis of the primer and probe sets for S. gracilenta was conducted using DNA extracts of S. gracilenta SGJH1904, 24 dinoflagellate species in Gymnodiniales, Amphidiniales, Dinophysales, Peridiniales, Suessiales, and Thoracosphaerales and cryptophycean prey T. amphioxeia (Supplementary Table S3).
The qPCR reaction mixture contained 1 μL of DNA template, 0.2 μM of specific forward and reverse primers, 0.15 μM of the specific probe, 5 μL of qPCRBIO Probe Separate-ROX (Genepole, Gwangmyeong, Korea), and deionized sterilized water (DDW; Bioneer), with a final total volume of 10 μL. The qPCR assay was performed using the Rotor-Gene Q (Qiagen, Hilden, Germany). The cycling conditions were initialized with a denaturation step at 95°C for 3 min, followed by 40 cycles of 10 s at 95°C for 10 s, and 58°C for 40 s.
Standard curve construction
A standard curve for determining the abundance of S. gracilenta was constructed using a qPCR. DNA was extracted from the culture of S. gracilenta SGJH1904 (104,000 cells mL−1) in the growth phase using the AccuPrep Genomic DNA Extraction Kit (Bioneer), targeting 1, 10, 100, 1,000, 10,000, and 100,000 S. gracilenta cells. The qPCR assay was conducted using the reaction mixture mentioned above under the following thermal cycling conditions: 95°C for 3 min, followed by 45 cycles of 10 s at 95°C for 10 s, and 58°C for 40 s.
Quantification using qPCR
DNA samples extracted from seawater were used as the template. Samples using a DDW as the template in the reaction mixture were used as non-template controls. Samples from S. gracilenta SGJH1904 as a template were used as positive and standard controls. The method and conditions used for qPCR to determine the abundance of S. gracilenta in field samples collected during 2015–2018 were the same as those described in the standard curve construction section.
Confirmation of the presence of Shimiella gracilenta
The abundance of S. gracilenta, measured using the qPCR method in the present study, was as low as 0.01–3 cells mL−1 at all the stations. Thus, surface water samples were collected from three stations in April 2021 to confirm the presence of S. gracilenta cells in the samples (Fig 1C). The aliquots were poured into 50 mL flasks containing T. amphioxeia or Pyramimonas sp. as prey. The flasks were incubated at 20°C under a 14 : 10 h light : dark cycle and 20 μmol photons m−2 s−1 of cool white fluorescent light for 3–4 days. After incubation, the contents of the flasks were distributed to 96-well plate chambers. When cells of a dinoflagellate similar to S. gracilenta were observed in each chamber in 96-well plates, single-cell isolations were conducted. Finally, two strains SGDA210406 and SGDA210429 from Taean, a strain SGMGP210406 from Mageompo, and two strains SGJG210428 and SGHJ210428 from Dangjin were established (Fig. 1C). The ITS rDNA sequences of these five strains were analyzed to confirm whether they were identical to S. gracilenta SGJH1904 (GenBank accession No. MN965778).
The 100–200 mL aliquots of the seawater samples were used to quantify the abundance of S. gracilenta using qPCR, as described above.
Feeding occurrence and mechanism
To explore the effects of prey species on the distribution of S. gracilenta, the prey species that S. gracilenta is able to feed on were investigated. Twenty-seven microalgal species and Mesodinium rubrum were provided as potential prey items (Supplementary Table S4). All prey species except the haptophyte Phaeocystis antarctica and the photosynthetic ciliate M. rubrum were grown in enriched f/2 or L1 seawater media under the same temperature and light conditions as described above (Guillard and Ryther 1962, Guillard and Hargraves 1993). Mesodinium rubrum cells were grown under the same temperature and light conditions described above, and T. amphioxeia was provided as prey. Cells of P. antarctica were grown at 5°C under a 14 : 10 h light : dark cycle and 50 μmol photons m−2 s−1 of cool white fluorescent light in enriched L1 seawater medium. The mean equivalent spherical diameter (ESD) of prey species was obtained from previous studies and literature (Mathot et al. 2000, Jeong et al. 2014, Lee et al. 2016, Lim et al. 2018, Eom et al. 2021). The ESD of Chrysochromulina sp. CSYS1905 and Apedinella sp. ASGY1807 was calculated in this study.
Experiment 1 was conducted to investigate whether S. gracilenta SGJH1904 was able to feed on the target prey species (Table 2). Moreover, the feeding mechanism of S. gracilenta with regard to the edible prey species was examined. Dense cultures of S. gracilenta growing on T. amphioxeia were transferred to 800-mL cell culture flasks containing fresh seawater and T. amphioxeia. When prey cells were not detectable (ND) in the seawater, 5-mL aliquots were removed from the flasks and the cell concentration of S. gracilenta was determined under a compound microscope (BX53; Olympus, Tokyo, Japan).
In this experiment, the initial concentrations of S. gracilenta and each target prey species were established by using an autopipette to deliver a predetermined volume of culture to 42-mL polycarbonate (PC) experimental bottles. One 42-mL PC experimental bottle containing mixtures of S. gracilenta and a target prey species, one prey-only control bottle, and one S. gracilenta-only control bottle were set up. The PC bottles were filled with freshly filtered seawater, capped, placed on a rotating wheel at 0.9 rpm (0.00017 ×g), and incubated under the same conditions as described above. For P. antarctica, this experiment was conducted at 10°C because this prey can grow at low temperatures. After 2, 24, and 48 h of incubation, a 5-mL aliquot from each bottle was removed and transferred to a 6-well plate chamber. Cells of S. gracilenta were tracked to examine physical contact, attack (attempt to capture), and successful capture (ingestion) using a dissecting microscope at a magnification of 10–63× and an inverted microscope at a magnification of 200–1,000× (Axiovert 200M; Carl Zeiss, Göttingen, Germany). Cells of S. gracilenta incubated with each target prey species were photographed at a magnification of 1,000× using an inverted microscope. The feeding mechanism of S. gracilenta on prey species was investigated using a video mounted on an inverted microscope at a magnification of 630–1,000×.
Effects of prey concentration on growth and ingestion rates
Experiment 2 was conducted to determine the specific growth and ingestion rates of S. gracilenta SGJH1904 as a function of prey concentration (Table 2). Dense cultures of S. gracilenta in a 250-mL flask were transferred to 1,000-mL PC bottles with freshly filtered seawater and T. amphioxeia prey (ca. 40,000 cells mL−1). A dense culture of T. amphioxeia in a 250-mL flask was transferred to a 1,000-mL PC bottle with f/2 medium. These stock cultures were incubated at 20°C under a 14 : 10 h light : dark cycle and 100 μmol photons m−2 s−1 of a light-emitting diode. We selected light intensity above which the maximum growth and ingestion rates of S. gracilenta (G. gracilentum) as a function of light intensity were observed (Jakobsen et al. 2000). Shimiella gracilenta cells were allowed to feed on prey cells for 4 days and then starved for 8 days. A negative growth rate of S. gracilenta (−0.1 d−1) was obtained in this culture, indicating a lack of residual growth of S. gracilenta after feeding on prey. Three 1-mL aliquots were removed from the stock cultures, and the concentrations of S. gracilenta and T. amphioxeia were determined.
Eight different initial concentrations of S. gracilenta and T. amphioxeia were established using an autopipette to deliver predetermined volumes into 38-mL flasks (Table 2). Triplicate flasks with predator-prey mixtures, prey-only controls (i.e., T. amphioxeia only), and predator-only controls (i.e., S. gracilenta only) were set up for the eight different cell concentrations of S. gracilenta and T. amphioxeia. The stock culture of the predator S. gracilenta was filtered through a 0.2-μm syringe filter (DISMIC-25CS type, 25 mm; Advantec, Toyo Roshi Kaisha Ltd., Chiba, Japan). The same amount of cell-free filtrate was added to the prey-only controls as the predator culture volume was added to the predator-prey mixtures. The stock culture of T. amphioxeia was filtered in the same manner. The same amount of cell-free filtrate was added to the predator-only controls as the prey culture volume was added to the predator-prey mixtures. This procedure ensured that the seawater conditions were similar to those of the predator-prey mixtures to determine the elevated growth rate as a result of predation alone. Five milliliters of f/2 medium were added to all the flasks that were then filled with freshly filtered seawater.
At the start of the incubation period, a 5-mL aliquot was taken from each flask to determine the actual concentrations of the predator and prey, and then fixed with 5% Lugol’s solution. Next, each flask was refilled to capacity with freshly filtered seawater and placed on a shelf under the above conditions. Dilution due to refilling of filtered seawater into each flask was considered when the growth and ingestion rates were calculated. After a 2-day incubation period, a 10-mL aliquot was taken from each flask and fixed as described above.
Fixed S. gracilenta and T. amphioxeia cells taken at the beginning of the incubation period and after 2 days of incubation were enumerated by counting all or >200 cells in 1-mL Sedgwick–Rafter chambers under a compound microscope.
The specific growth rate of S. gracilenta (μ, d−1) was calculated using the following equation:
, where C0 and Ct represent the concentration of S. gracilenta at the beginning of incubation and after the elapsed time (t) of incubation, respectively.
The results for the growth rate of S. gracilenta with T. amphioxeia cells were fitted to the Michaelis–Menten equation using DaltaGraph (SPSS Inc., Chicago, IL, USA):
, where μmax is the maximum growth rate (d−1), x is the concentration of T. amphioxeia prey (ng C mL−1), x′ is the threshold prey concentration (i.e., prey concentration where μ = 0), and KGR is the prey concentration sustaining half of μmax.
The ingestion and clearance rates were calculated using the equation of Frost (1972) and the modified equation of Heinbokel (1978). Data for the ingestion rates of S. gracilenta (IR; ng C predator−1 d−1) were also fitted to the Michaelis–Menten equation:
, where Imax is the maximum ingestion rate, and KIR is the prey concentration sustaining half of Imax. The carbon content of T. amphioxeia was obtained from Jeong et al. (2005b).
Effects of filtrates of prey culture and f/2 medium on the growth rate
Experiment 3 was conducted to determine whether filtrates of stock cultures of T. amphioxeia (i.e., without prey cells) or f/2 medium affected the growth rates of S. gracilenta SGJH1904. The growth rates of S. gracilenta with T. amphioxeia cells, only T. amphioxeia filtrates, only f/2 medium, and without any addition were compared (Table 2). Data on the growth rates of S. gracilenta with T. amphioxeia cells and without prey cells but filtrates (i.e., predator-only controls) were obtained from the results of experiment 2. For experiments involving the addition of f/2 medium or no additions, S. gracilenta cells were satiated with T. amphioxeia for 14 days, followed by starvation for 26 days. At this point, the growth rate of S. gracilenta was negative (−0.1 d−1). A single high concentration of S. gracilenta (5,000 cells mL−1) was set up in triplicate. The growth rate of S. gracilenta was determined as described previously.
Statistical analysis
Pearson’s correlation analysis was used to test the relationships between the abundance of S. gracilenta and biotic / abiotic factors. Data on the abundances of T. amphioxeia and Pyramimonas sp. at 28 stations from 2015 to 2018 were obtained from Jang and Jeong (2020). One-way analysis of variance (ANOVA) with a post-hoc Tukey’s honestly significant difference test was used to compare the growth rates of S. gracilenta SGJH1904 with T. amphioxeia cells, only T. amphioxeia filtrates, f/2 medium, and without any addition. The normality and homogeneity of the data were tested prior to the one-way ANOVA analysis. Statistical significance was set at p < 0.05. All statistical analyses were performed using SPSS ver. 25.0 (IBM-SPSS Inc., Armonk, NY, USA).
RESULTS
Specificity test and standard curve construction
The species specificity of the primer and probe set developed in this study was tested using S. gracilenta SGHJ1904 and the other 25 species (Supplementary Table S3). Shimiella gracilenta was positively detected, whereas the remaining species were negatively detected.
The standard curve indicated high linearity between log cell number and cycle threshold (Ct) with r2 = 0.996 (Supplementary Fig. S1). The slope for Ct as a function of log cell abundance was −3.18, which corresponds to an efficiency of 106%.
Spatial distributions in Korean waters
Using the primer and probe set developed in this study, the abundance of S. gracilenta in water samples from 28 stations from April 2015 to October 2018 was quantified (Table 3). Cells of S. gracilenta were detected at all the 28 stations from 2015 to 2018, indicating its wide spatial distribution. However, its cell abundance in Korean coastal waters in 2015 to 2018 was very low (Table 3); the highest abundance of S. gracilenta (2.96 cells mL−1) was found in Seogwipo (Jeju Island), and the second highest abundance (2.25 cells mL−1) was in the waters off Ansan.
Temporal distributions in Korean waters
Cells of S. gracilenta were detected during all four seasons: 18 stations in spring and summer, 16 stations in autumn, and 13 stations in winter (Fig. 2). The highest and second highest abundances of S. gracilenta (2.96 and 2.25 cells mL−1, respectively) were found in the summer of 2016 and 2017, respectively (Table 3, Fig. 2B). In spring, autumn, and winter seasons in 2015 to 2018, the highest abundances of S. gracilenta were <1 cell mL−1 (Fig. 2A, C & D): 0.71 cells mL−1 in spring, 0.61 cells mL−1 in autumn, and 0.63 cells mL−1 in winter (Table 3).
Hydrographic and biological properties
Abiotic environmental factors, such as water temperature, salinity, and DO, varied greatly between 2015 and 2018 (Table 4). Cells of S. gracilenta were detected in Korean coastal waters when water temperature, salinity, and DO ranged 1.7–26.4°C, 9.9–35.6, and 0.7–14.2 mg L−1, respectively (Table 4). Furthermore, when S. gracilenta was detected, the concentrations of NO3, PO4, and SiO2 were in between ND–107.1, ND–6.3, and ND–448.4 μM, respectively. The highest abundance of S. gracilenta (2.96 cells mL−1) was detected when the water temperature and salinity were 20.4°C and 17.5, respectively (Fig. 3A); moreover, this abundance value was observed when NO3 and PO4 concentrations were 43.0 and 0.90 μM, respectively (Fig. 3B). However, S. gracilenta abundance was significantly correlated with water temperature and salinity, but not with DO, NO3, PO4, and SiO2 (Table 4).
Biotic factors such as Chl-a and the abundance of the prey species T. amphioxeia or Pyramimonas sp. from 2015 to 2018 also varied considerably (Table 4). Cells of S. gracilenta were detected when Chl-a ranged from 0.2 to 59.1 μg L−1. Moreover, S. gracilenta was also detected when the abundances of T. amphioxeia and Pyramimonas sp. were 0–666.5 and 0–917.6 cells mL−1, respectively. However, the abundance of S. gracilenta was not significantly correlated with Chl-a or abundance of T. amphioxeia or Pyramimonas sp. (Table 4, Fig. 3C–E).
Confirmation on the presence of Shimiella gracilenta
The sequences of ITS rDNA of the five S. gracilenta strains (SGMGP210406, SGDA210406, SGJG210428, SGHJ 210428, and SGDA210429) were 100% identical to that of S. gracilenta SGJH1904 (Table 5).
When the qPCR method was used, the abundance of S. gracilenta in the water samples at stations where the cells of the five strains were isolated ranged from 0.31 to 2.94 cells mL−1 (Table 5). The water temperature and salinity when these five strains were isolated ranged 9.6–14.9°C and 29.2–31.3, respectively (Table 5).
Prey type
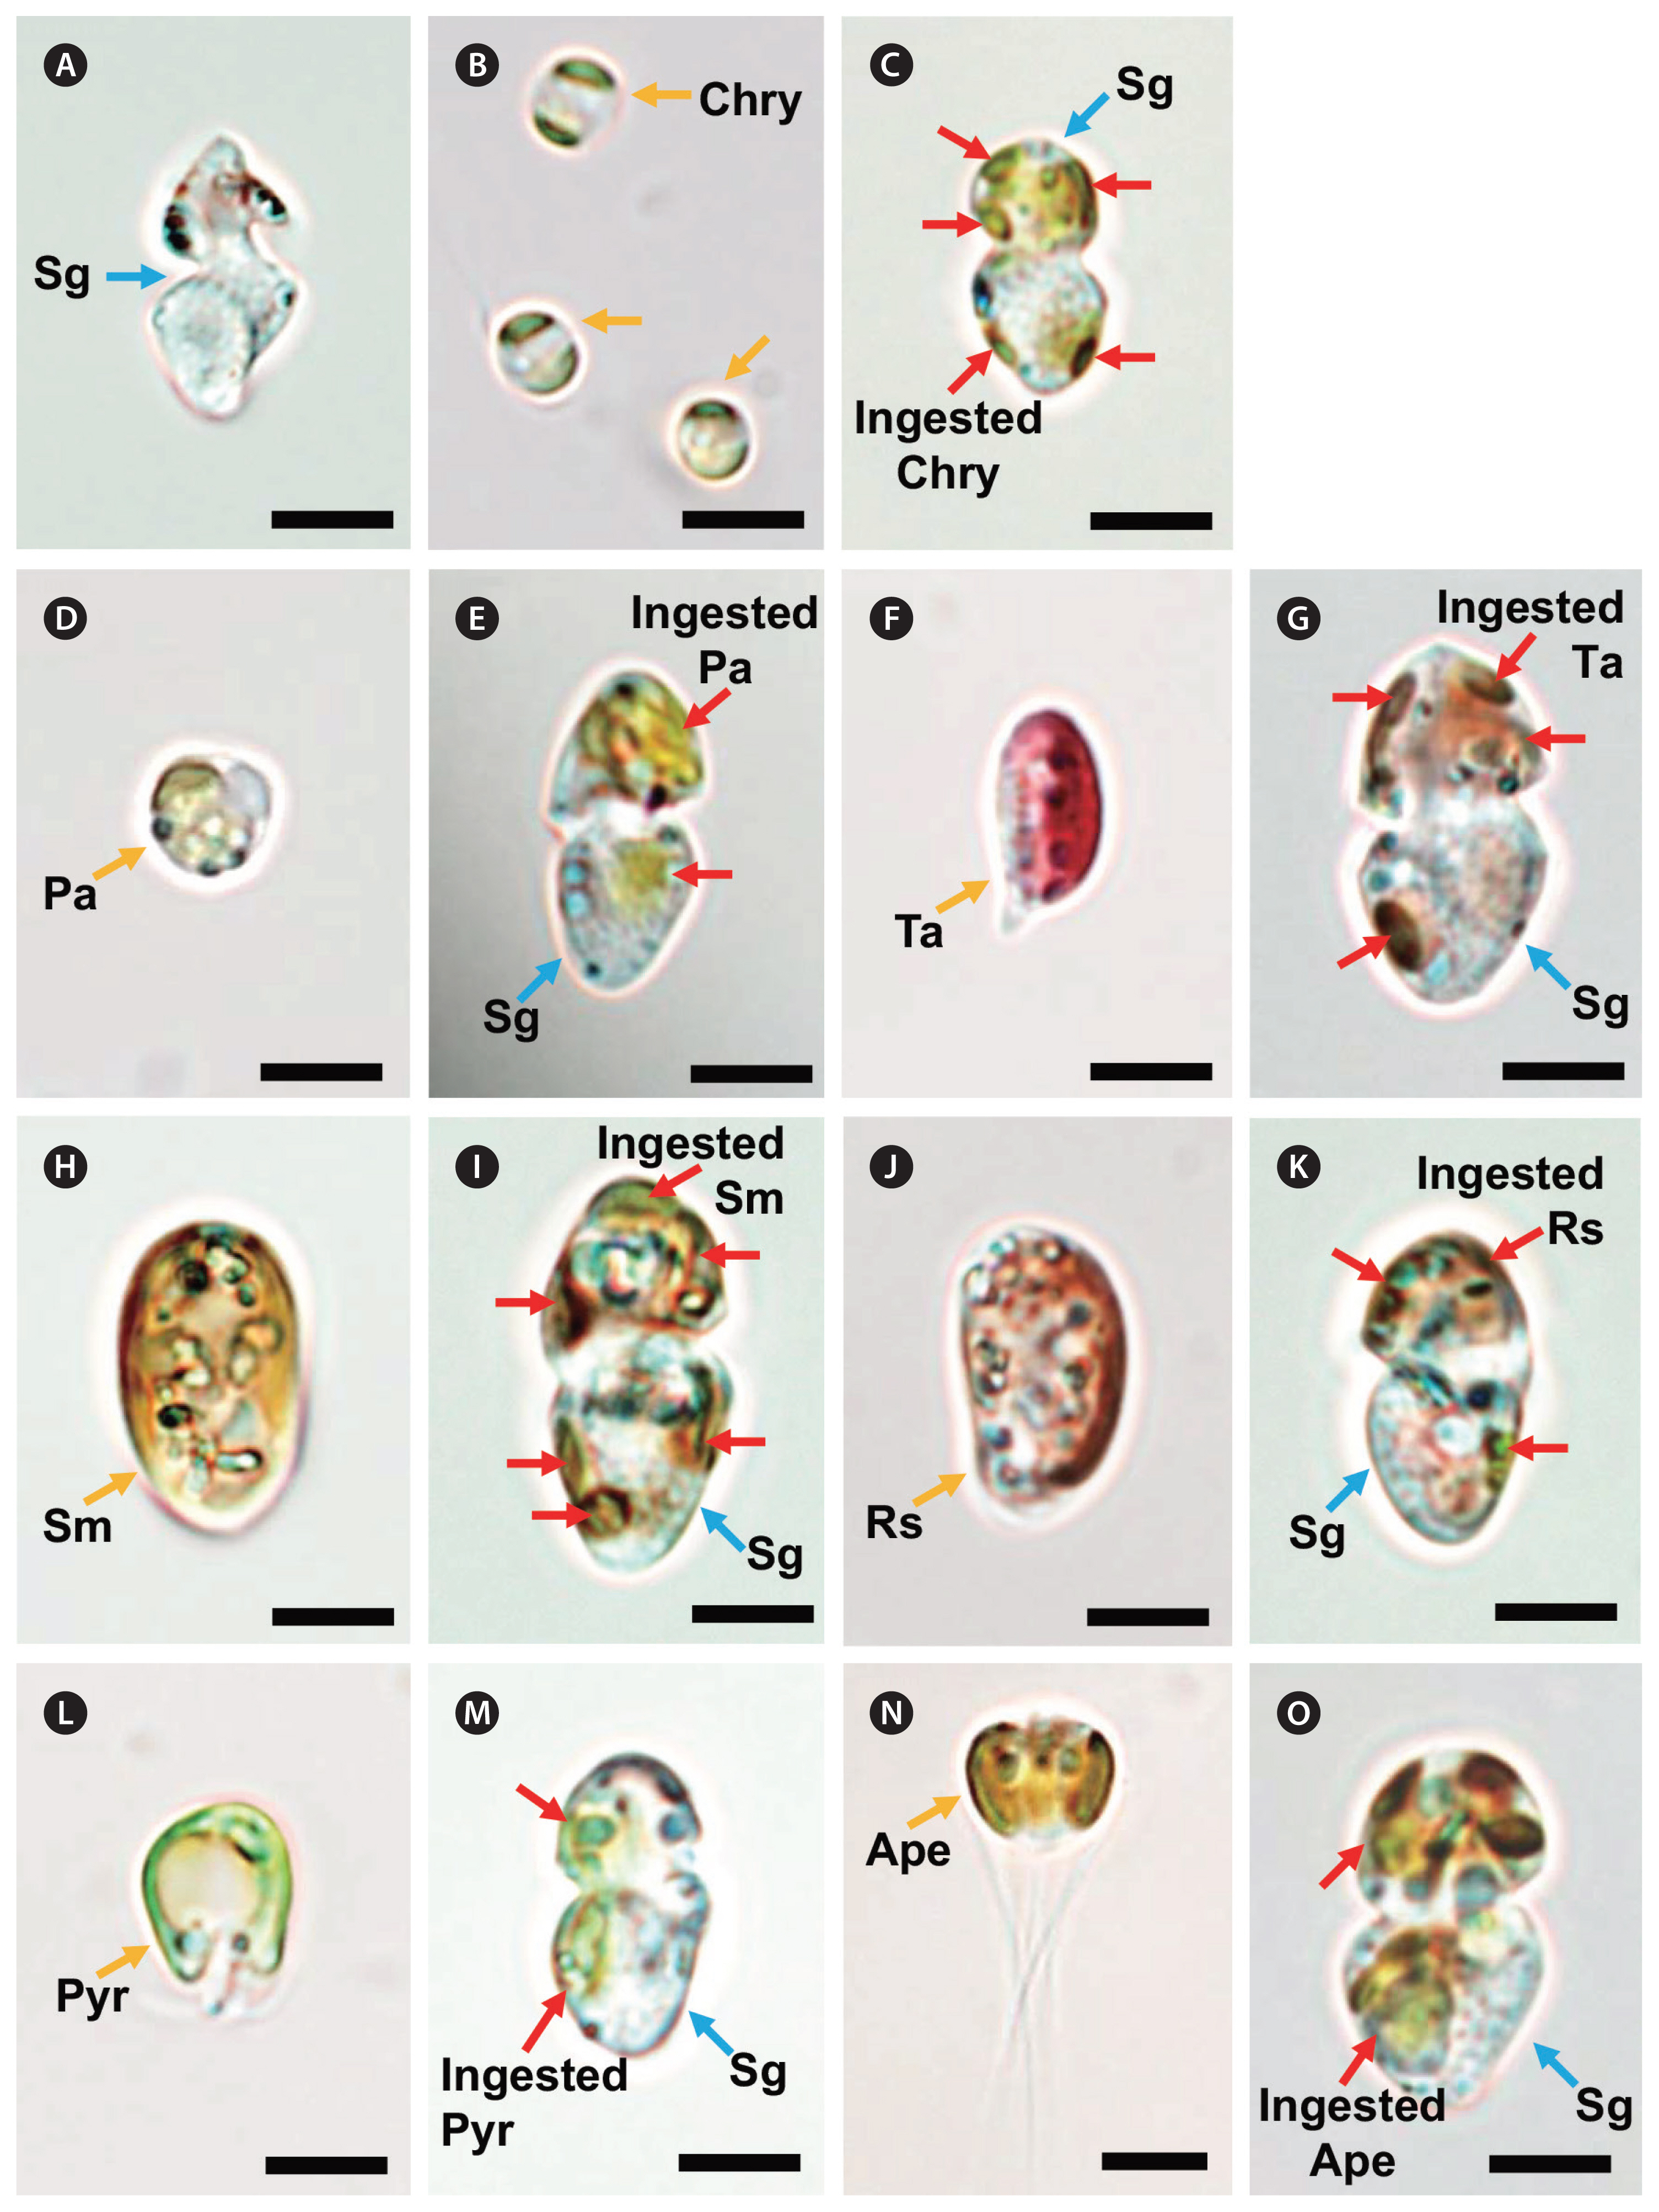
Among the microalgal and ciliate species that were provided as prey, S. gracilenta SGJH1904 was observed to feed on the prymnesiophytes Chrysochromulina sp. and P. antarctica, the cryptophytes T. amphioxeia, Storeatula major, Rhodomonas salina, the prasinophyte Pyramimonas sp., and the dictyochophyte Apedinella sp. (Table 6). The ESD of these prey species were ≤8.8 μm (Table 6). Under a light microscope, yellowish, greenish, or reddish prey materials were observed inside the protoplasm of S. gracilenta cells (Fig. 4). However, S. gracilenta cells did not feed on the prymnesiophyte Isochrysis galbana, the chlorophyte Dunaliella salina, the dictyochophyte Pseudopedinella elastica, the raphidophyte Heterosigma akashiwo, the diatom Skeletonema costatum, all the dinoflagellates tested in this study, and the ciliate M. rubrum (Table 6). Among these microalgal and ciliate species, although S. gracilenta was found to attack I. galbana and S. costatum, it failed to ingest these two species.
Feeding mechanism
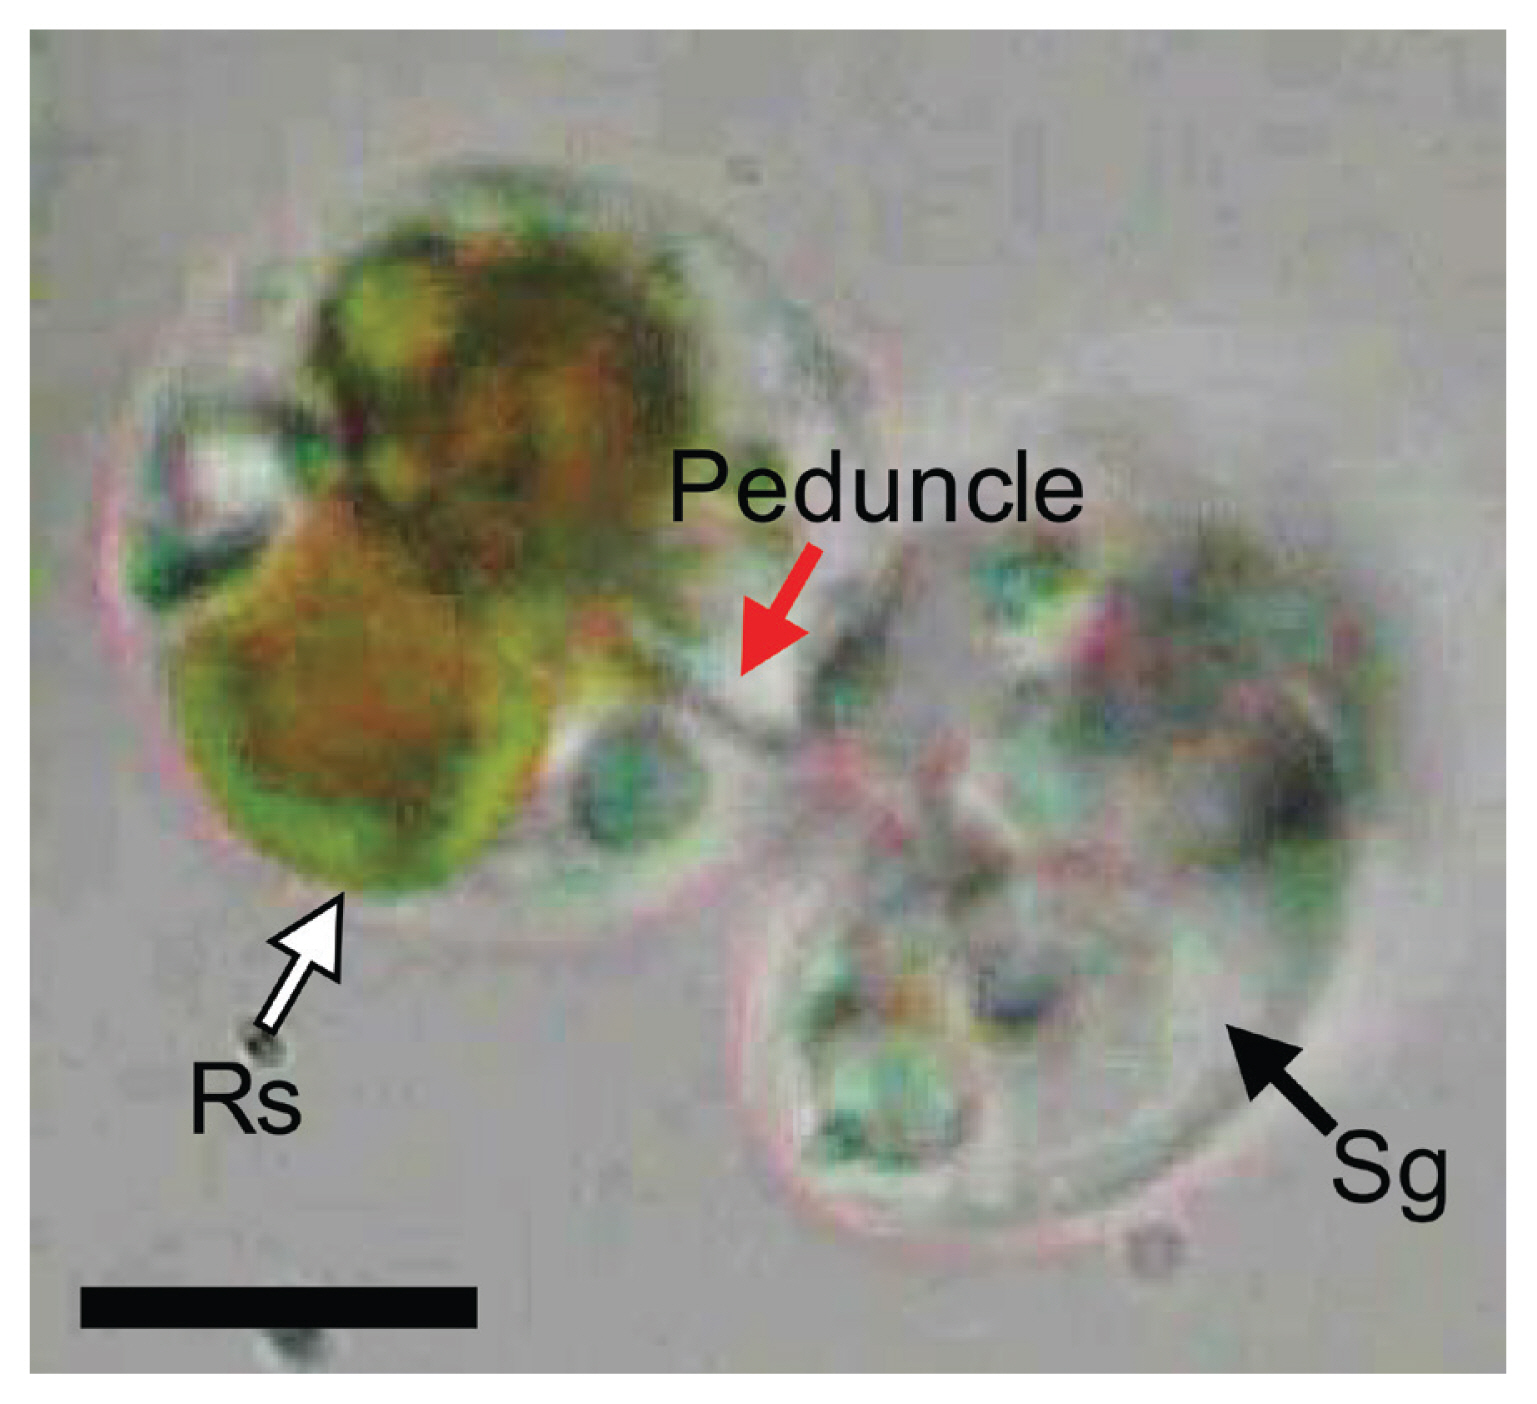
Shimiella gracilenta SGJH1904 fed on a R. salina cell using a peduncle (Fig. 5). The materials (yellow) were observed to be transported from the prey to the predator through a thin peduncle.
Effects of prey concentration on the growth rate
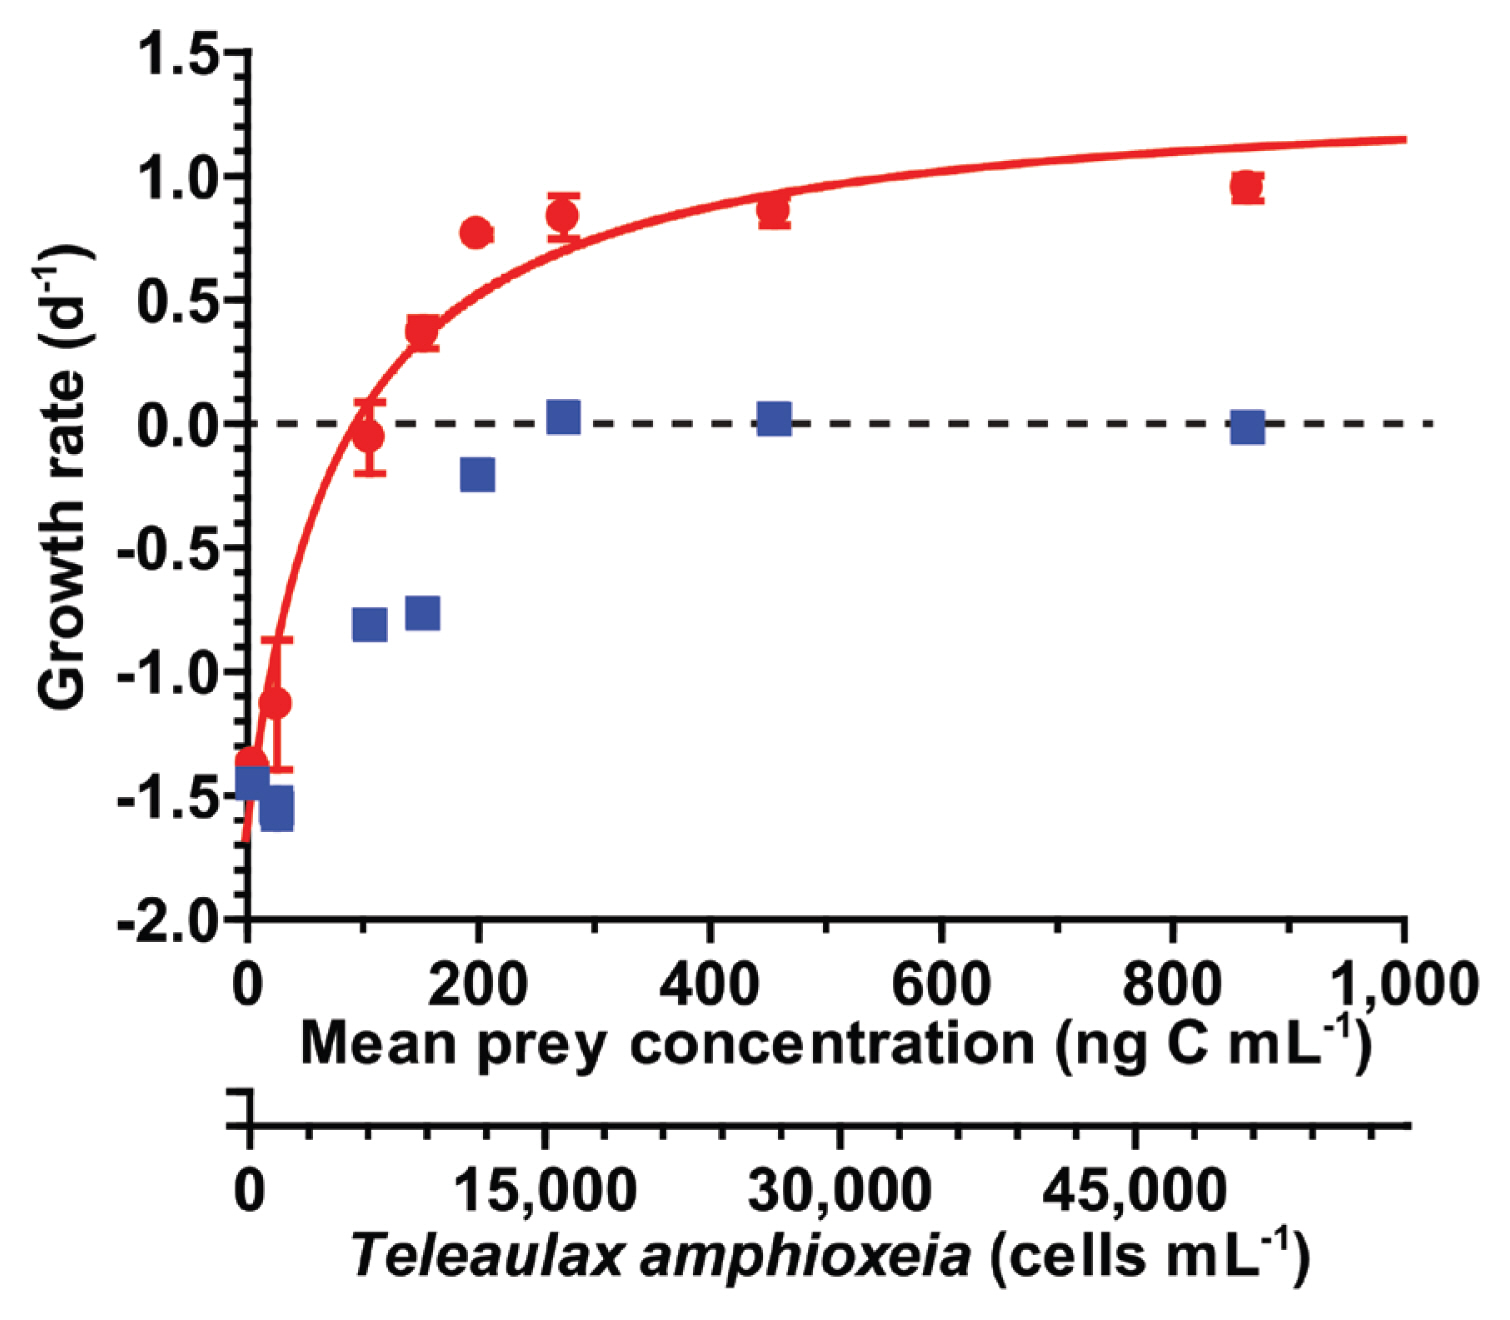
With increasing mean prey concentrations, the specific growth rate of S. gracilenta SGJH1904 on T. amphioxeia rapidly increased at mean prey concentrations of ≤199 ng C mL−1 (11,697 cells mL−1). However, it became saturated at higher mean prey concentrations (Fig. 6). When these data were fitted to equation (2), the μmax and KGR of S. gracilenta feeding on T. amphioxeia were 1.36 d−1 and 173 ng C mL−1 (10,176 cells mL−1), respectively. The threshold prey concentration for the growth of S. gracilenta was 95.5 ng C mL−1 (5,618 cells mL−1). The highest specific growth rate of S. gracilenta with T. amphioxeia filtrate (without T. amphioxeia prey cells) was 0.03 d−1 (Fig. 6).
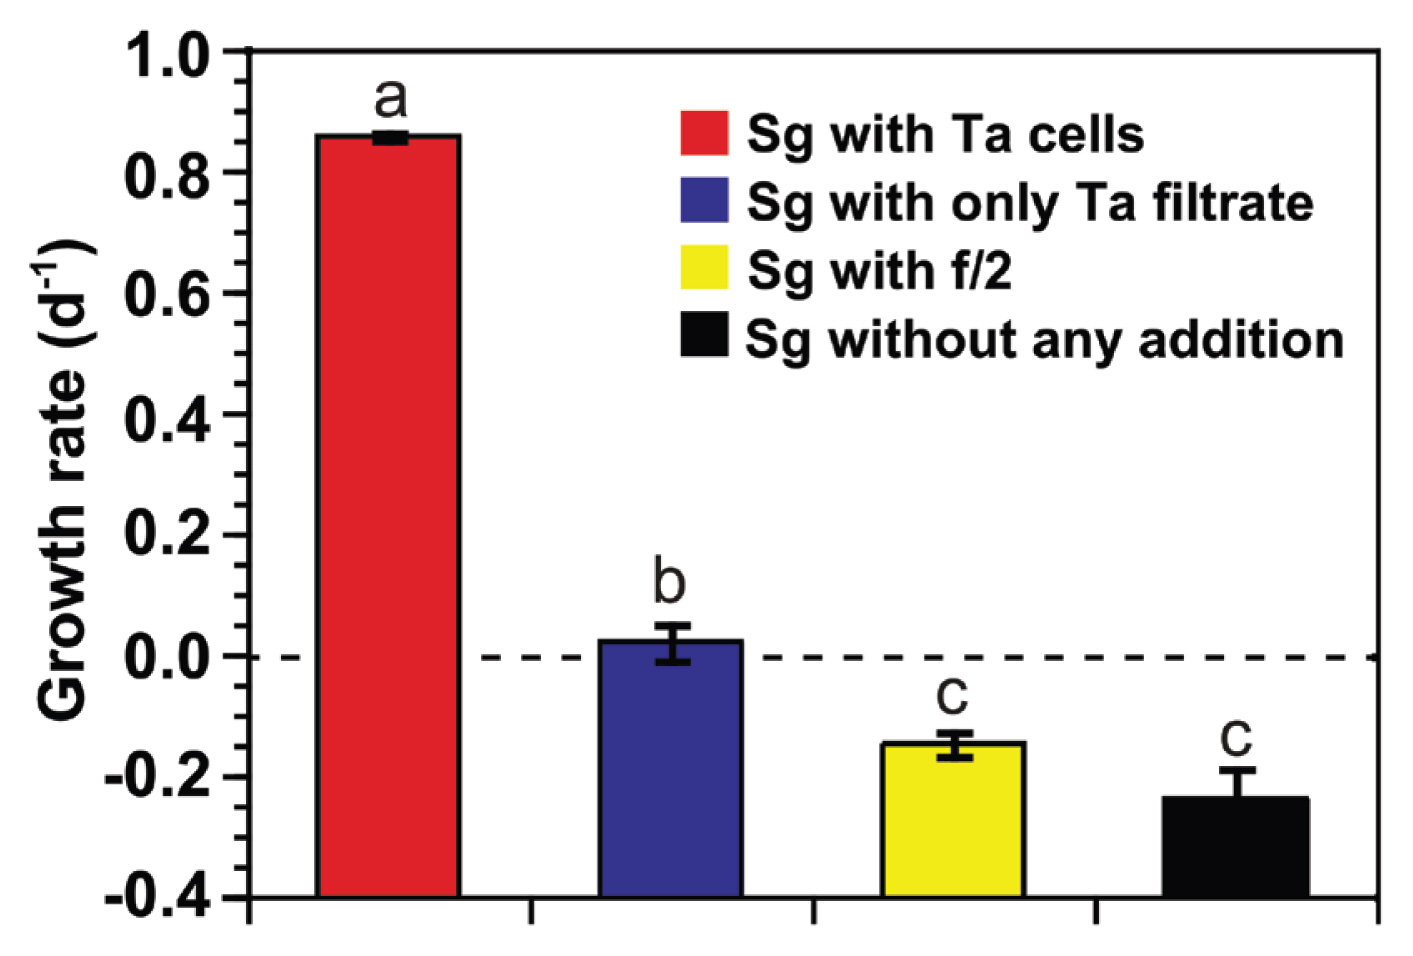
Effects of filtrates of prey culture and f/2 medium on the growth rate
At a single high S. gracilenta concentration (5,000 cells mL−1), the specific growth rates of S. gracilenta SGJH1904 with T. amphioxeia cells, only T. amphioxeia filtrates, f/2 medium, and without any addition were significantly different (one-way ANOVA, F3, 8 = 242.3, p < 0.001) (Fig. 7). The growth rate of S. gracilenta with T. amphioxeia filtrate (0.02 d−1) was significantly higher than that with f/2 medium (−0.15 d−1) or without any additions (−0.24 d−1).
Effects of prey concentration on the ingestion rate
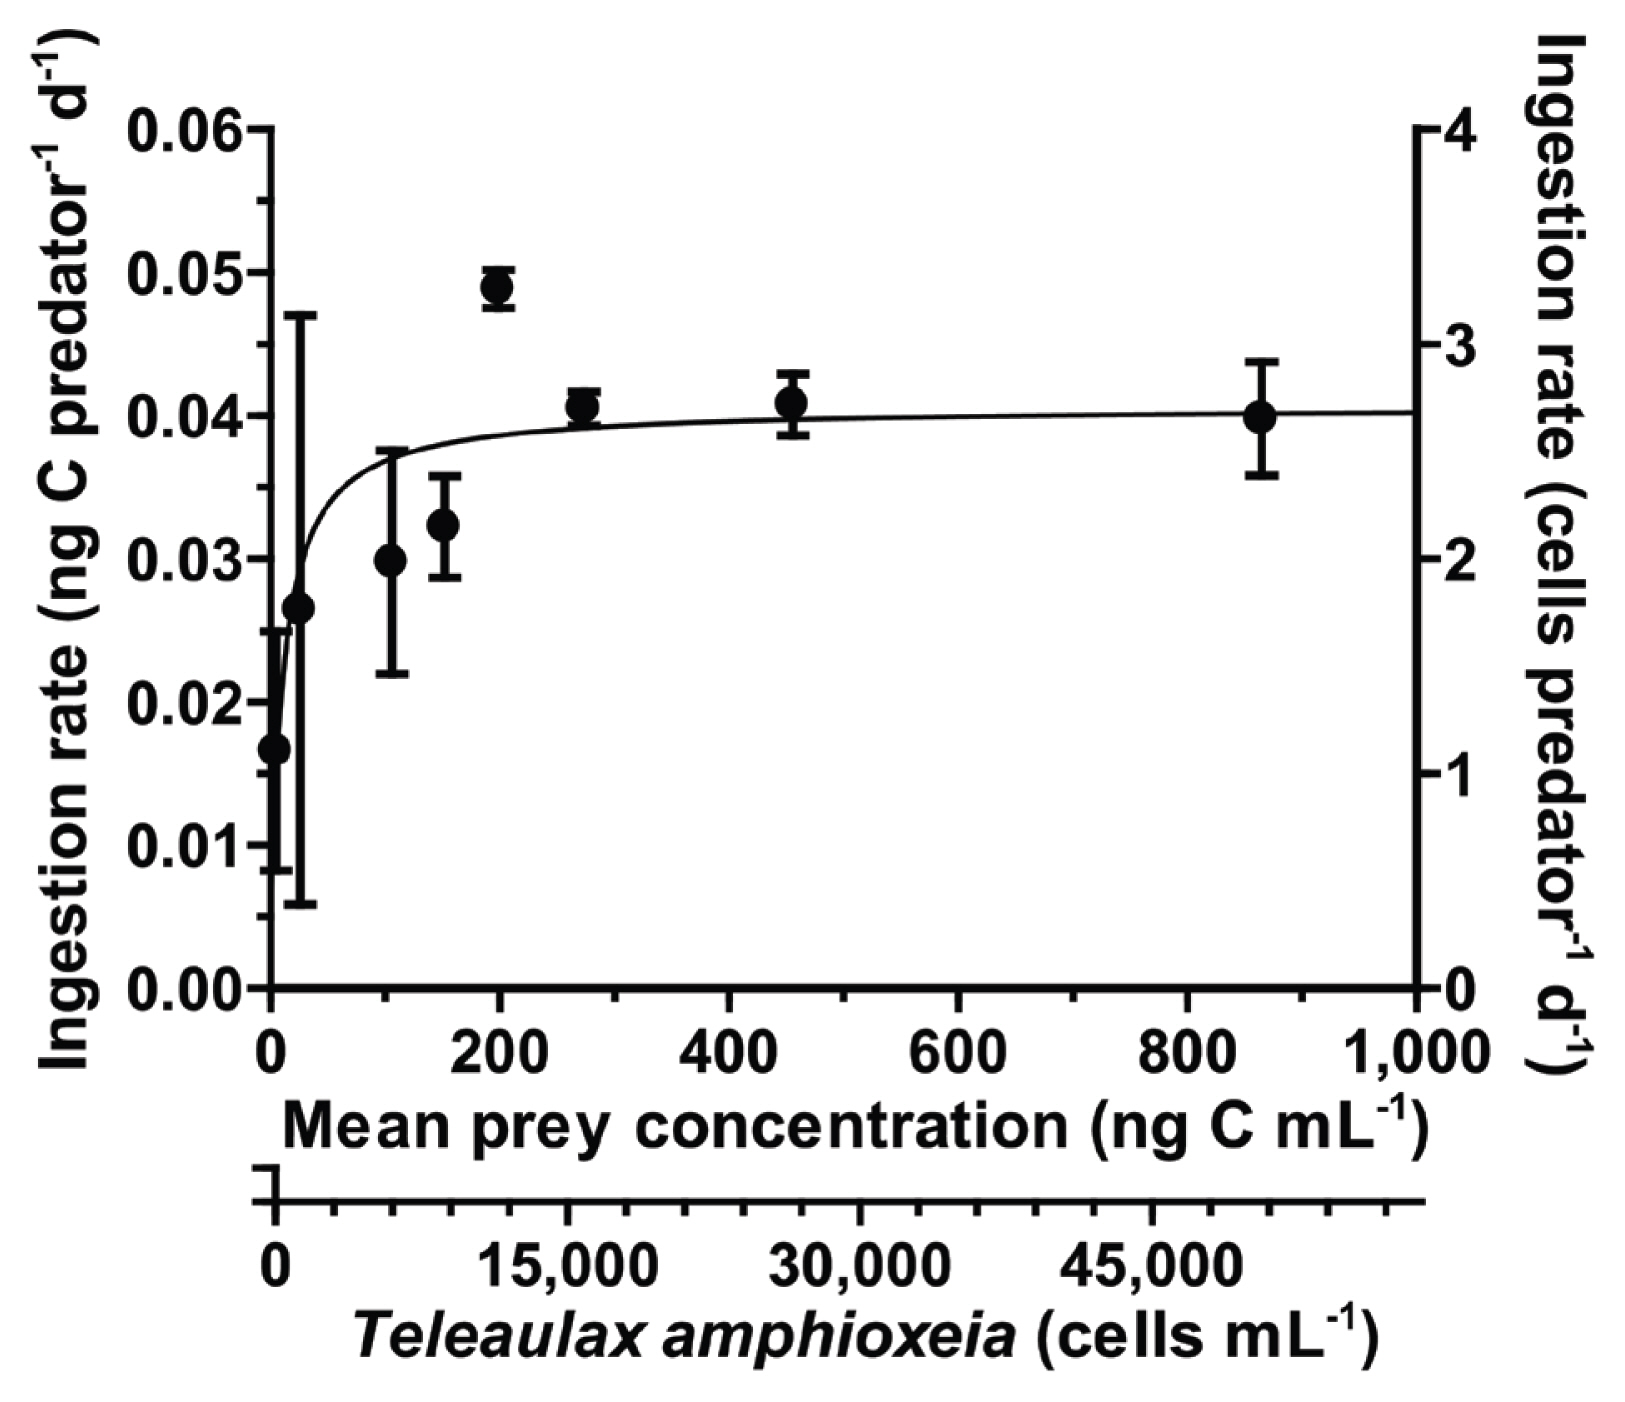
With increasing mean prey concentrations, the ingestion rate of S. gracilenta SGJH1904 on T. amphioxeia increased rapidly at mean prey concentrations of ≤199 ng C mL−1 (11,697 cells mL−1), but became saturated at higher mean prey concentrations (Fig. 8). When these data were fitted to equation (3), the Imax and KIR of S. gracilenta feeding on T. amphioxeia were 0.04 ng C predator−1 d−1 (2.35 cells predator−1 d−1) and 10.5 ng C mL−1 (618 cells mL−1), respectively.
DISCUSSION
The present study demonstrates that S. gracilenta has a wide spatial distribution in Korean coastal waters from 33°14′ N to 38°10′ N. Prior to the present study, S. gracilenta was reported in the waters from 29° N to 80° N; Kuwait coastal waters (29° N) (Al-Mutairi et al. 2020), U. S. coastal waters (34° N) (Campbell 1973), Korean coastal waters (35° N) (Ok et al. 2021a), Scandinavian waters (51–55° N) (Skovgaard 1998, Martin and Gypens 2021), and the Arctic Ocean (69–80° N) (de Sousa 2020, Back et al. 2021). These regions are all located in the northern hemisphere, and S. gracilenta cells have not been reported to be present in the Southern Hemisphere. Hence, additional data on the distribution and abundance of S. gracilenta on a global geographic scale are needed.
In the present study, S. gracilenta was found during all four seasons in the period from 2015 to 2018 and at 1.7–26.4°C, indicating that S. gracilenta has a wide temporal distribution. However, the highest abundance of S. gracilenta was observed in summer when the water temperature was 20.4°C in the study area. Furthermore, the abundance of S. gracilenta was positively correlated with water temperature. In addition, Campbell (1973), who had first described S. gracilenta (reported as G. gracilentum), reported that the highest abundance in Gales Creek was observed in summer (18 cells mL−1). This evidence suggests that the abundance of S. gracilenta is seasonal.
The abundance of S. gracilenta was negatively correlated with salinity. The salinity range when S. gracilenta cells were detected was very wide (9.9–35.6). Campbell (1973) also reported that this species was present in a similar salinity range of 9–30. Thus, S. gracilenta may survive in estuaries, where salinity fluctuates due to freshwater or effluent inputs. In Kuwait Bay, S. gracilenta was observed under a microscope at a salinity of approximately 44 (Al-Mutairi et al. 2020). Thus, S. gracilenta can survive under high-salinity conditions. Therefore, the reported salinity range of S. gracilenta cells was from 9 to 44, indicating that it is a euryhaline species. Overall, these euryhaline and eurythermal characteristics of S. gracilenta may be partially responsible for its wide spatial and temporal distributions in Korean waters.
The growth rate of S. gracilenta SGJH1904 was largely affected by T. amphioxeia prey concentration; thus, prey availability may strongly affect its abundance. Shimiella gracilenta (G. gracilentum) has been known to feed on cryptophytes Chroomonas sp., Plagioselmis prolonga, Rhodomonas marina, R. salina, and T. amphioxeia (Jakobsen et al. 2000). However, the present study clearly showed that S. gracilenta was able to feed on prymnesiophytes, a prasinophyte, a dictyochophyte, and another cryptophyte S. major. Moreover, S. gracilenta can reportedly utilize kleptoplastidy to survive for approximately one month in the absence of prey (Ok et al. 2021a). Thus, its ability to feed on diverse prey and conduct kleptoplastidy may also contribute to the wide spatial and temporal distributions of S. gracilenta in Korean waters.
In the present study, the highest abundance of S. gracilenta was only 2.96 cells mL−1, although cells were detected in all the 28 stations. The threshold T. amphioxeia prey concentration for S. gracilenta (i.e., no growth) in the present study was 5,618 cells mL−1 (95.5 ng C mL−1). However, the highest abundance of T. amphioxeia during the study period was 667 cells mL−1 (11.3 ng C mL−1). Using the equation in Fig. 6 and the abundance of T. amphioxeia during the study period from 2015 to 2018, the calculated specific growth rates of S. gracilenta on T. amphioxeia were negative (−1.7 to −1.3 d−1). Therefore, the abundance of T. amphioxeia in Korean waters during the study period was likely insufficient to support the positive growth of S. gracilenta. Furthermore, in the present study, the abundance of S. gracilenta was not significantly correlated with the abundance of T. amphioxeia or Pyramimonas sp. The low abundance of T. amphioxeia or Pyramimonas sp. may be partially responsible for this insignificant correlation. However, the maximum growth rates of S. gracilenta on suitable prey species were 1.36–1.51 d−1, which are among the highest maximum growth rates of dinoflagellates feeding on T. amphioxeia (Table 7). Thus, there is a possibility that the abundance of S. gracilenta rapidly increases if the abundance of T. amphioxeia is higher than 5,618 cells mL−1 in natural environments. The abundance of cryptophytes, including the genus Teleaulax, in natural seawater, has been reported as 392,440 cells mL−1 (6,671 ng C mL−1) in Masan Bay, Korea, 15,720 cells mL−1 (267 ng C mL−1) in Chesapeake Bay, USA, and 2,173 cells mL−1 (37 ng C mL−1) in Blanes Bay, Spain (Jeong et al. 2013, Johnson et al. 2013, Unrein et al. 2014). Assuming that all cryptophytes are T. amphioxeia in natural seawaters, the specific growth rates of S. gracilenta were calculated to be 1.33 d−1 in Masan Bay, 0.68 d−1 in Chesapeake Bay, and −0.70 d−1 in Blanes Bay. Therefore, S. gracilenta is expected to be highly abundant in Masan Bay, moderately abundant in Chesapeake Bay, and rare in Blanes Bay under these prey concentrations.
When S. gracilenta was detected during 2015–2018, the highest Chl-a was 59 ng mL−1, which was calculated to be 2,360 ng C mL−1, assuming a carbon to chlorophyll ratio of 40 (Cloern et al. 1983, Peterson and Festa 1984). This carbon value is much higher than the threshold T. amphioxeia prey concentration for S. gracilenta. Based on the results of high Chl-a but low abundance of S. gracilenta during the study period, it is suggested that phytoplankton species that are not fed on by S. gracilenta may have contributed to the high Chl-a.
Identifying S. gracilenta in field samples under a light microscope is difficult because cells of S. gracilenta are very small (9.3 μm in ESD) (Park et al. 2021) and fragile. Since the abundance of S. gracilenta during 2015–2018 was generally low, this study confirmed the detection of S. gracilenta by qPCR using a suitable prey enrichment and incubation method. The present study successfully confirmed that S. gracilenta cells were present even when <1 cell mL−1 of S. gracilenta was detected by qPCR. In conclusion, the qPCR method used in the present study is a suitable method for quantifying S. gracilenta abundance in natural seawaters, as well as a suitable prey enrichment and incubation method for confirming the presence of low abundance of S. gracilenta.
The Imax of S. gracilenta on T. amphioxeia in the present study and the literature (0.04–0.08 ng C predator−1 d−1) is comparable to that of the mixotrophic dinoflagellates Prorocentrum donghainese, Prorocentrum micans, Heterocapsa steinii, and Gymnodinium aureolum (0.03–0.06 ng C predator−1 d−1), but lower than that of many mixotrophic, kleptoplastidic, and heterotrophic dinoflagellates on the same prey species (Table 7). Furthermore, the peduncle-feeding S. gracilenta has an Imax comparable to that of G. aureolum but lower than that of other peduncle-feeding dinoflagellates (0.18–1.10 ng C predator−1 d−1). Although the Imax of S. gracilenta on T. amphioxeia was relatively low, the μmax of S. gracilenta on T. amphioxeia was greater than that of the other dinoflagellates on the same prey species. The ratio of the newly produced carbon by S. gracilenta SGJH1904 to ingested prey carbon, calculated as described by Skovgaard (1998), was >1.0. Thus, S. gracilenta SGJH1904 may conduct kleptoplastidy during satiation with prey cells as well as starvation.
The specific growth rate of S. gracilenta SGJH1904 with T. amphioxeia filtrate was significantly higher than that with f/2 medium and without any addition. The materials in the prey filtrates were likely to increase the growth rates of S. gracilenta SGJH1904. Some phagotrophic dinoflagellates have been reported to utilize dissolved organic materials for their growth (Ou et al. 2014, Hattenrath-Lehmann and Gobler 2015). This evidence suggests that S. gracilenta may be able to maintain its abundance using dissolved organic materials released from prey cells.
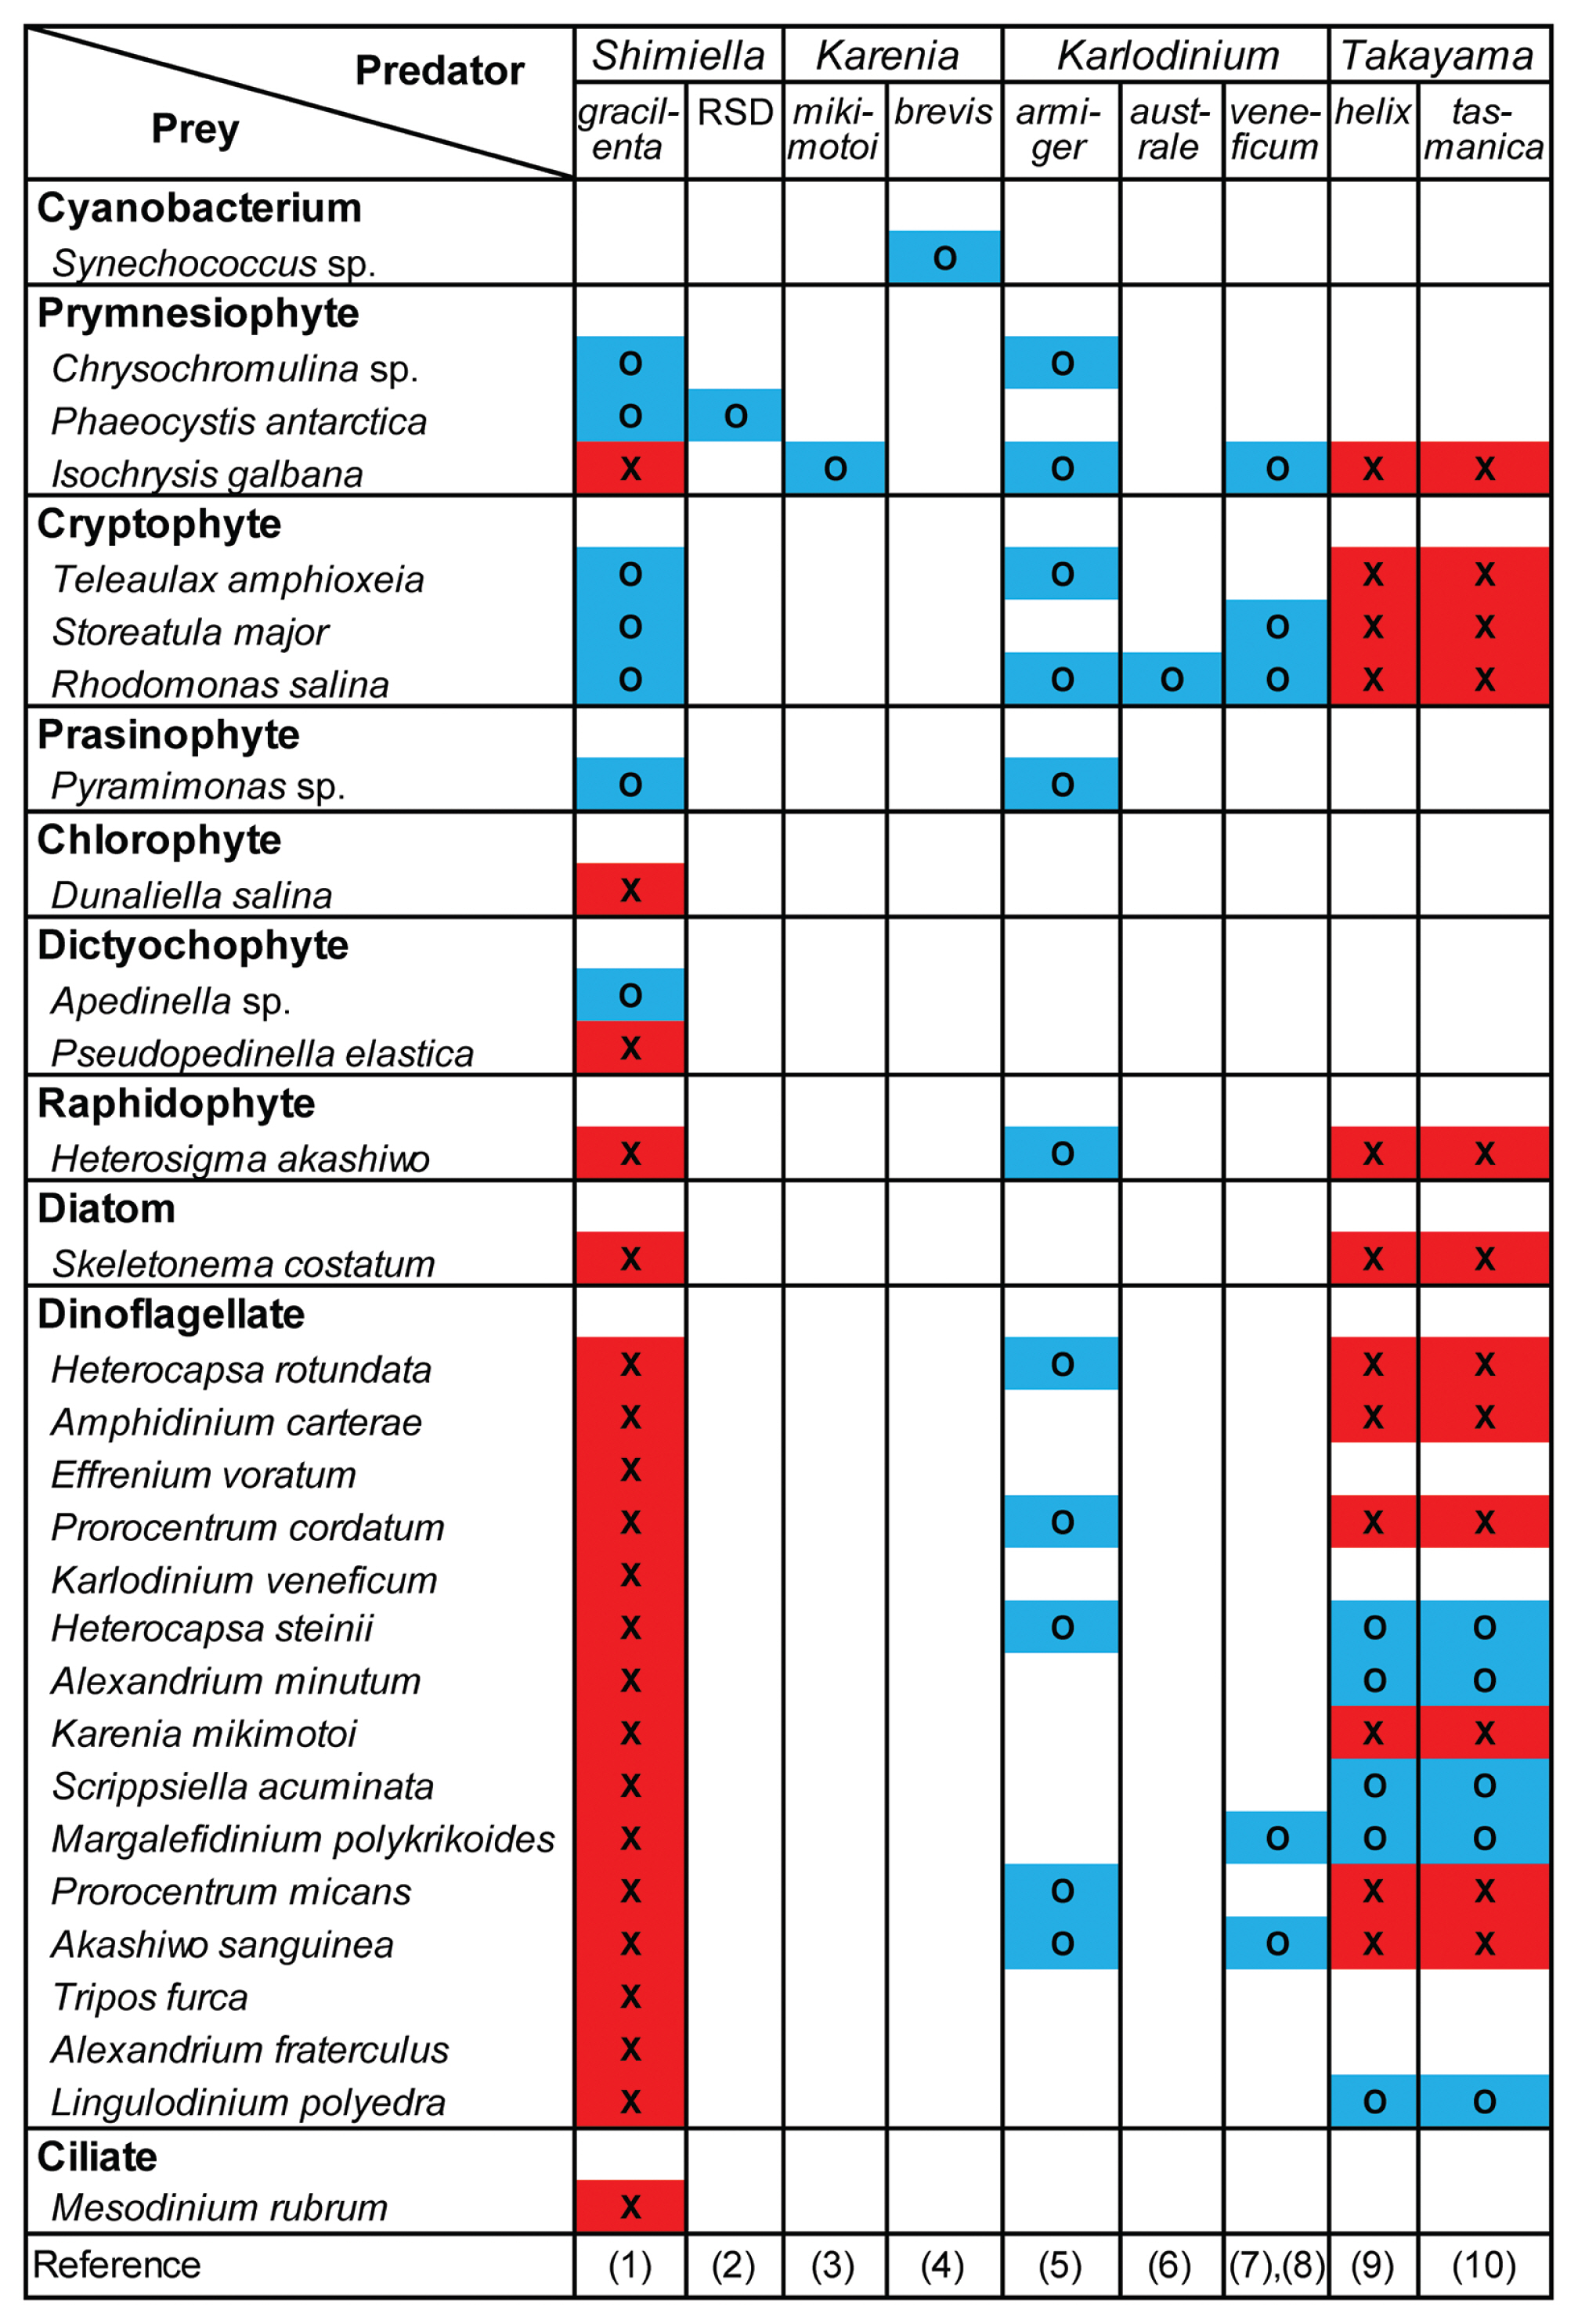
Many species in the family Kareniaceae, to which S. gracilenta belongs, are known to be mixotrophic or kleptoplastidic dinoflagellates (Li et al. 1999, de Salas et al. 2005, Berge et al. 2008, Glibert et al. 2009, Zhang et al. 2011, Sellers et al. 2014, Jeong et al. 2016, Lim et al. 2018, Yang et al. 2020). Interestingly, the different genera in this family have different prey spectra (Fig. 9): Takayama spp. were observed to feed only on dinoflagellates (Jeong et al. 2016, Lim et al. 2018); Karenia spp. were observed to feed on a cyanobacterium or prymnesiophyte (Glibert et al. 2009, Zhang et al. 2011); Karlodinium spp. feed on diverse prey taxa including prymnesiophytes, cryptophytes, a prasinophyte, a raphidophyte, and dinoflagellates (Li et al. 1999, de Salas et al. 2005, Berge et al. 2008, Yang et al. 2020). Shimiella gracilenta was also observed to feed on various prey taxa, including prymnesiophytes, cryptophytes, a prasinophyte, and a dictyochophyte; however, we did not observe it feeding on dinoflagellates. A possibility that these genera acquired different kleptoplastids from different prey has been suggested (i.e., horizontal gene transfer) (Hehenberger et al. 2019). Thus, differences in the prey spectra among the genera in the family may have led to their generic divergence. Moreover, S. gracilenta was able to feed on the prymnesiophyte P. antarctica that the Ross Sea dinoflagellate, sister species of S. gracileta, selectively fed on (Sellers et al. 2014). The Ross Sea dinoflagellate was found in the Antarctic region, whereas S. gracilenta SGJH1904 was isolated from temperate coastal waters (Gast et al. 2006, Ok et al. 2021a). Therefore, S. gracilenta shared the same prey species as sister species, although they lived in largely different regions.
In conclusion, the ecophysiological characteristics of S. gracilenta can be summarized as follows: (1) S. gracilenta has a wide spatial and temporal distributions in Korean coastal waters; (2) it has the ability to survive in wide ranges of water temperature and salinity, ranging 1.7–26.4°C and 9.9–35.6, respectively; (3) S. gracilenta is able to feed on diverse prey species; and (4) it can divide more than twice a day if the optimal prey, T. amphioxeia, is abundant; but (5) it demands approximately 6,000 cells mL−1 of T. amphioxeia as a threshold concentration for growth. Overall, its eurythermal and euryhaline characteristics and the ability to feed on diverse prey species and conduct kleptoplastidy may be responsible for its wide spatial and temporal distributions.